

The 30 Day Map Challenge:
Graduate Certificate in Geospatial Programming and Web Map Development – Penn State University
GEOG 485 GIS Programming and Software Development Python
There are currently a wide variety of international organizations that play a significant role in the response to natural disaster, military conflict, and other unfortunate situations. An important aspect in disaster response and refugee accommodation is healthcare. Crisis events often result in internally displaced persons (IDPs) or asylum seekers who rely on medical services in a place that is unfamiliar to them.
Over the past decade it has been necessary for the country of Bulgaria to respond to considerable flows of displaced persons and refugees. According to the Republic of Bulgaria State Agency for Refugees, in 2022 alone, 20,407 individuals sought asylum or refugee status in Bulgaria.[i] The United Nations Refugee Agency (UNHCR) states that, “since the start of the conflict in Ukraine, Bulgaria has received over half a million refugees at its borders and has given temporary protection to approximately 124,000 Ukrainian refugees, 92 per cent of whom are women and children. Between 85-86,000 Ukrainian refugees remain within the country as of 5 August 2022.” [ii] It seems that there are considerable discrepancies in the data.

Being that it is one of the poorest countries in the European Union, Bulgaria is poorly equipped to manage with such events, especially in regards to its creaking medical facilities. Responding quickly to crisis situations requires better cooperation and organization and data sharing across a variety of governmental and non-governmental institutions and agencies. GIS is well suited to help better inform and improve communication through the use of spatial data analysis, mapping and visualization tools. There has also been a recognized shift in disaster response to disaster preparedness. This project is well suited to serve both of those functions.
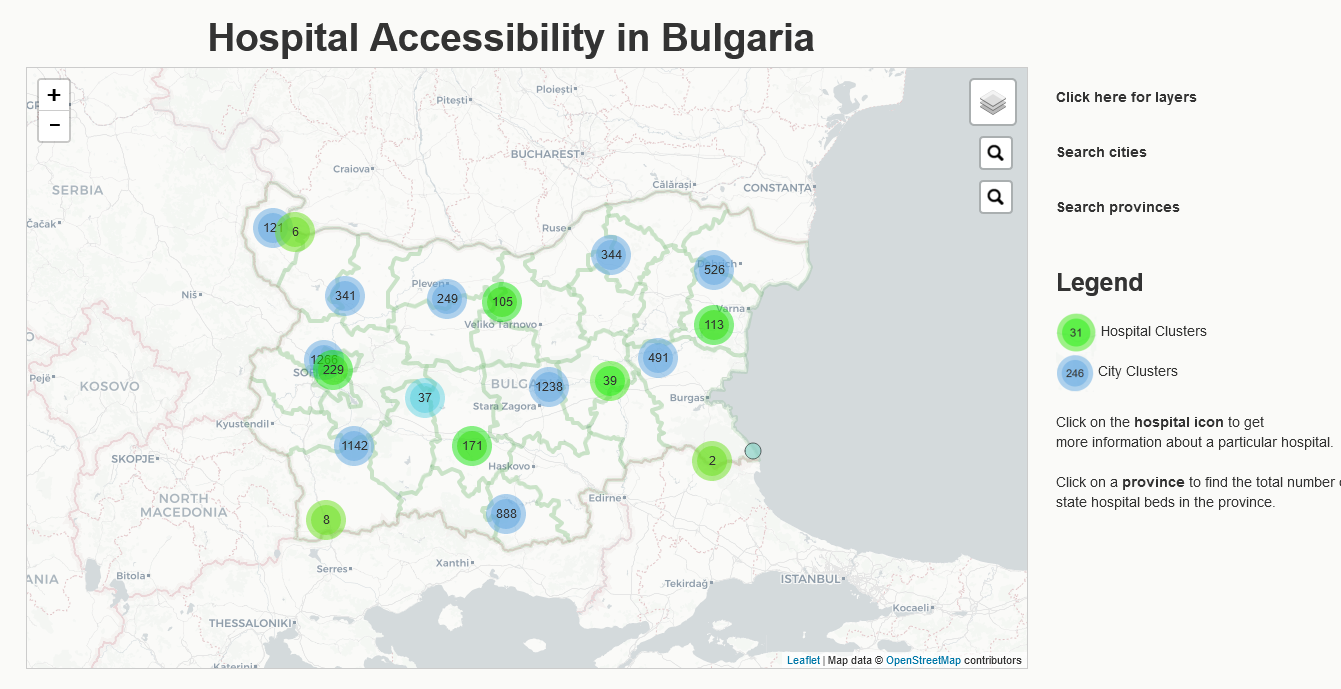
The UNHCR has an impressive array of GIS products available, such as geospatial data on UNHCR presence, UNHCR warehouses, people of concern (refugees and internally displaced persons), administration boundaries and border crossing points, and even official UNHCR ArcGIS Pro templates. My project will seek to create a python script tool in ArcGIS Pro that will aid in the use of these resources, especially for the context of Bulgaria and the strain that unfortunate events have on the healthcare system.
The current capacity of hospitals in Bulgaria is extremely low. Not only that, but GIS data on hospitals in Bulgaria on Open Street Map is still very much incomplete, and is especially lacking fields translated into English, which would be of paramount importance to any who does not speak Bulgarian, whether international aid worker or asylum seeker.
A script tool has several very important advantages. It can be easily shared with others, ensuring consistent results and standardization across projects and users. This is particularly beneficial in collaborative environments where multiple users need to execute similar processes. A great deal of relevant data is currently in a variety of formats, which lends itself to be easily integrated to a database using a python script. Scripts can easily create features, add fields and populate them with in a standardized way.
Final result of arcpy script in ArcGIS Pro:
[i] “Actual Information” Republic of Bulgaria State Agency for Refugees at the Council of Ministers: (English/Bulgarian)
[ii] Ukraine situation: Bulgaria: UNHCR Operational Update (5 August 2022)
https://data.unhcr.org/en/documents/details/95092
Final Project: GEOG 868 Spatial Database Management
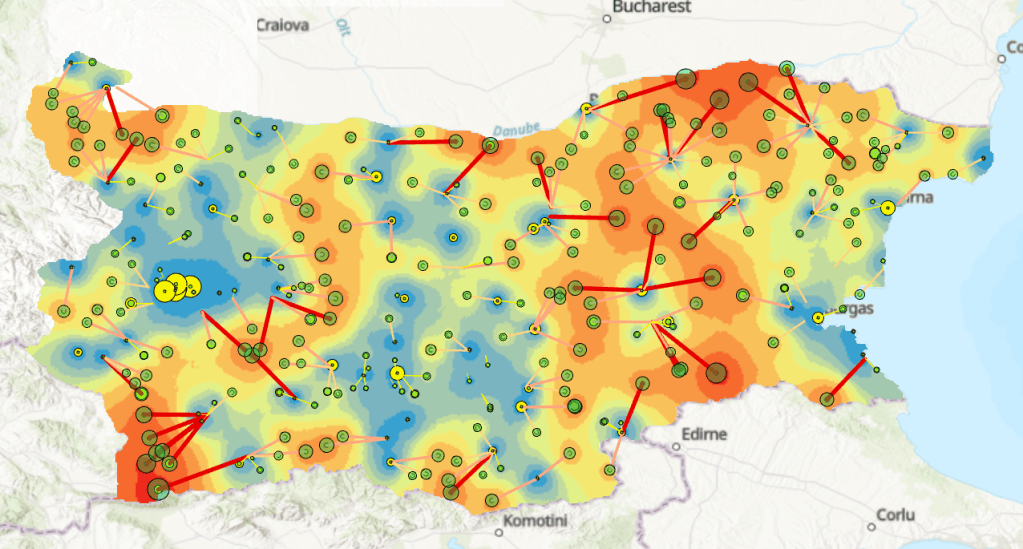
The spatial distribution and development of broadband internet in Wisconsin.
It goes without saying that fast and reliable internet speeds are a necessity in this day and age. However, as one takes a closer look, the weight of the issue becomes clearer. There are significant discrepancies in internet use according to factors such as income, education, and race.[1] According to the FCC, “35% of Americans do not have reliable access to service (25MB download / 3MB upload).” [2] An FCC report also states that “Overall, per-person usage is growing substantially (30-35% per year)” and that “actual download speeds experienced by U.S . consumers lag advertised speeds by roughly 50%.” [3] The report also mentions the importance of informing consumers as to the complexity of the various aspects related to why “real” internet speeds are often lower than advertised. A relational database management system (RDBMS) has the potential to address a long list of questions relevant to the topic.
- A RDBMS could be used by telecommunications companies to identify the most profitable areas for expansion. By integrating data sources like population demographics, existing infrastructure, and market demand, companies can identify areas with the highest potential for ROI.
- Upon research, it was clear that both governmental and non-governmental organizations in Wisconsin actively analyze what areas are the least served by operators, and the most economically distressed. By combining broadband data with social and economic indicators, it is possible to pinpoint regions where broadband access could have a significant impact on economic development. The impact of broadband on medicine and agriculture are two topics raised by researchers that are also worth exploring.
- There is a clear need for collaboration among stakeholders, including government agencies, broadband providers, and researchers. Their efforts are evident on the web. The possibility to access and analyze open data would lead to better-informed decisions and coordinated efforts. For example, the government and public may be interested to take a closer look at what companies receive the most grants and assess the actual implementation of these projects and analyze its economic impact. A RDMS could easily store a wide array of information about each grant in a organized and efficient manner. What are the characteristics of the communities that are receiving grants? The US Census data could easily provide insights into those matters. How many households or buildings are affected by each project? The Wisconsin Broadband Office (WBO) and the Public Service Commission (PSC) in fact, provide that detailed of information (https://apps.psc.wi.gov/ERF/ ).[4]
When it comes to broadband in Wisconsin, one can be overwhelmed by the amount of open data. The FCC, ACS, Wisconsin Broadband Office (WBO), USDA’s ReConnect Loan and Grant Program, Ookla, to name but a few, provide a wide array of open data.
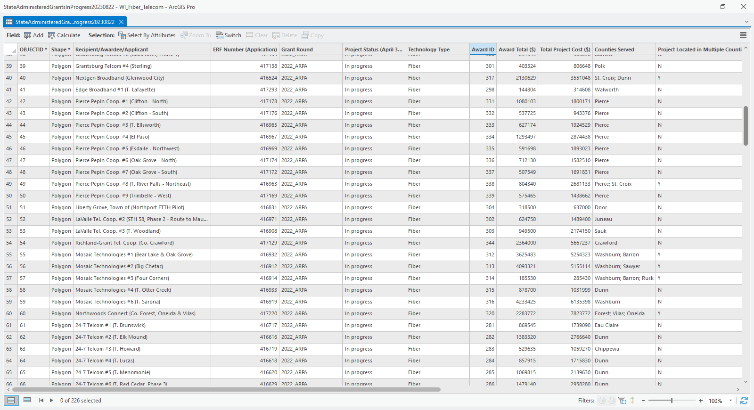
Normalizing the data:
Below is a screenshot of “grants in progress” for 2023. One can immediately see that the table is far from normalized. Take for example, the “Recipient/Awardee/Applicant” column, which is not even in first normal form (1NF). There are also many columns with low cardinality.[5] A careful look at how to best design a database to address these issues would take time and careful consideration. I also realized that it was incredibly important to keep the end goal in mind and develop an efficient workflow.
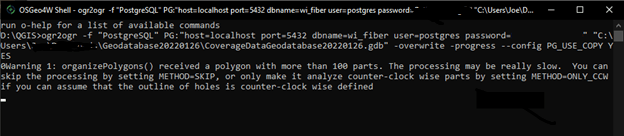
At a certain point, I also realized that there needed to be a more seamless connection between QGIS and PostGIS, especially in regards to the ability to do certain spatial functions more effectively in QGIS and then export the data from QGIS and import it into the database. See endnote for more.[i] Another thing that I wished that I had learned earlier was how to import geodatabases straight into PostGIS. The following post on GIS StackExchange helped greatly.[1] The ogr2ogr tool can be used with the OSGeo4W Shell to import geodatatbases directly.[2] The tool worked quite well for me for a number of geodatabases, but I also found it quite difficult to troubleshoot if the import was not successful.
Wading through data:
It is impossible to design an effective database without having in mind the data that is available and the types of questions that you want to ask it. To be honest, I found that just assessing what data was available on the web and what types of columns each table contained to take an incredible amount of time. I frequently found myself opening the same table several times to remember the exact name of the column that I wanted to reference in a query. Maintaining the same data type across imported tables also proved to be a challenge. For example, the block number was listed as an integer in one table and as “character varying” (VARCHAR) in another, both by different field names. Time also turned out to be an important factor. Many sources of data referenced different census years, and the census blocks do change over time. Even though some of the shapefiles were from the exact same source, they had different SRIDs.
Perhaps one of the most difficult questions was to determine what data is not necessary. There were many shapefiles from the WBO where it was not clear what the column indicated as they did not include any metadata.
Grant table: bbgf20230822
| Recipient | erfnumber | grantround |
| “BEVCOMM / Hager Telecom (T. Diamond Bluff, Phase 3)” | 381038 | “2020” |
| “BEVCOMM/Hagar Telecom (Town of Diamond Bluff, Phase 2)” | 346422 | “2019” |
| “Bloomer Tel. Co. #1 (T. Eagle Point)” | 416881 | “2022_ARPA” |
| “Bloomer Tel. Co. #2 (T. Tilden)” | 416879 | “2022_ARPA” |
| “Bloomer Tel. Co. #2 (T. Tilden, Phase 2)” | 459813 | “2023” |
In fact, upon closer look, it seems that two telecommunication companies work in partnership for some grants. For example, the “BEVCOMM” appears work independently at times and also have partnerships with “Indianhead Tel. Co.” and “Hager Telecom.”
In fact, upon closer look, it seems that two telecommunication companies work in partnership for some grants. For example, the “BEVCOMM” appears work independently at times and also have partnerships with “Indianhead Tel. Co.” and “Hager Telecom.”
| Recipient |
| “BEVCOMM #1 / Hager Telecom (T. Hartland & Trenton)” |
| “BEVCOMM #2 / Indianhead Tel. Co. (Potato Lake)” |
| “BEVCOMM (Rural Exeland Exchange)” |
| “BEVCOMM (T. Couderay & Radisson)” |
| “BEVCOMM / Hager Telecom (T. Diamond Bluff, Phase 3)” |
| “BEVCOMM/Hagar Telecom (Town of Diamond Bluff, Phase 2)” |
| “Hager Telecom, Inc. d/b/a BEVCOMM” |
Categorizing Data:
Could certain columns be given something similar to a coded value domain in ArcGIS Pro? For example, records for download and upload speed seem to be quite repetitive. It turns out domains are simply constraints in on a particular data type in Postgres.[1] However, it is possible to make lookup tables in Postgres and then map the code and descriptions for each.[2]
| speed_maxd | count |
| 0 | 197 |
| 25 | 20 |
| 100 | 14 |
| 200 | 4 |
| 940 | 10 |
| 1000 | 185 |
| 2000 | 5 |
| 10000 | 10 |
| 100000 | 5 |
-- SQL Query:

SELECT speed_maxd, COUNT(*) AS count

FROM wi_fiber_schema.bbgf20230822

GROUP BY speed_maxd

HAVING COUNT(*) > 1

ORDER BY speed_maxd ASC;
[1] https://www.postgresql.org/docs/current/sql-createdomain.html
[2] https://gis.stackexchange.com/questions/218988/coded-value-domains-in-postgresql
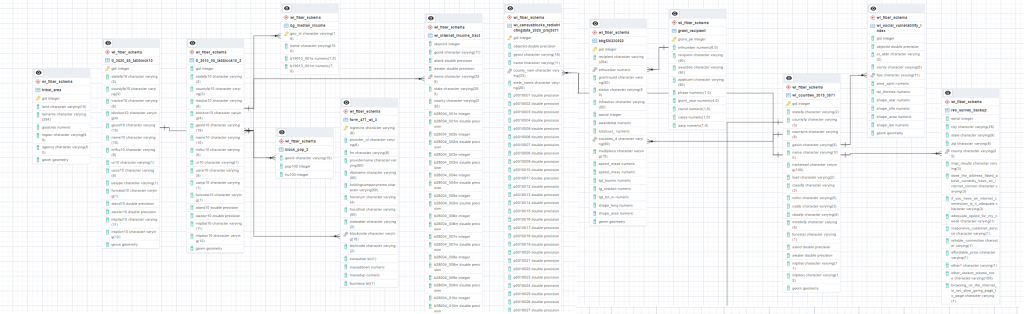
Entity-Relationship Diagram (ERD)
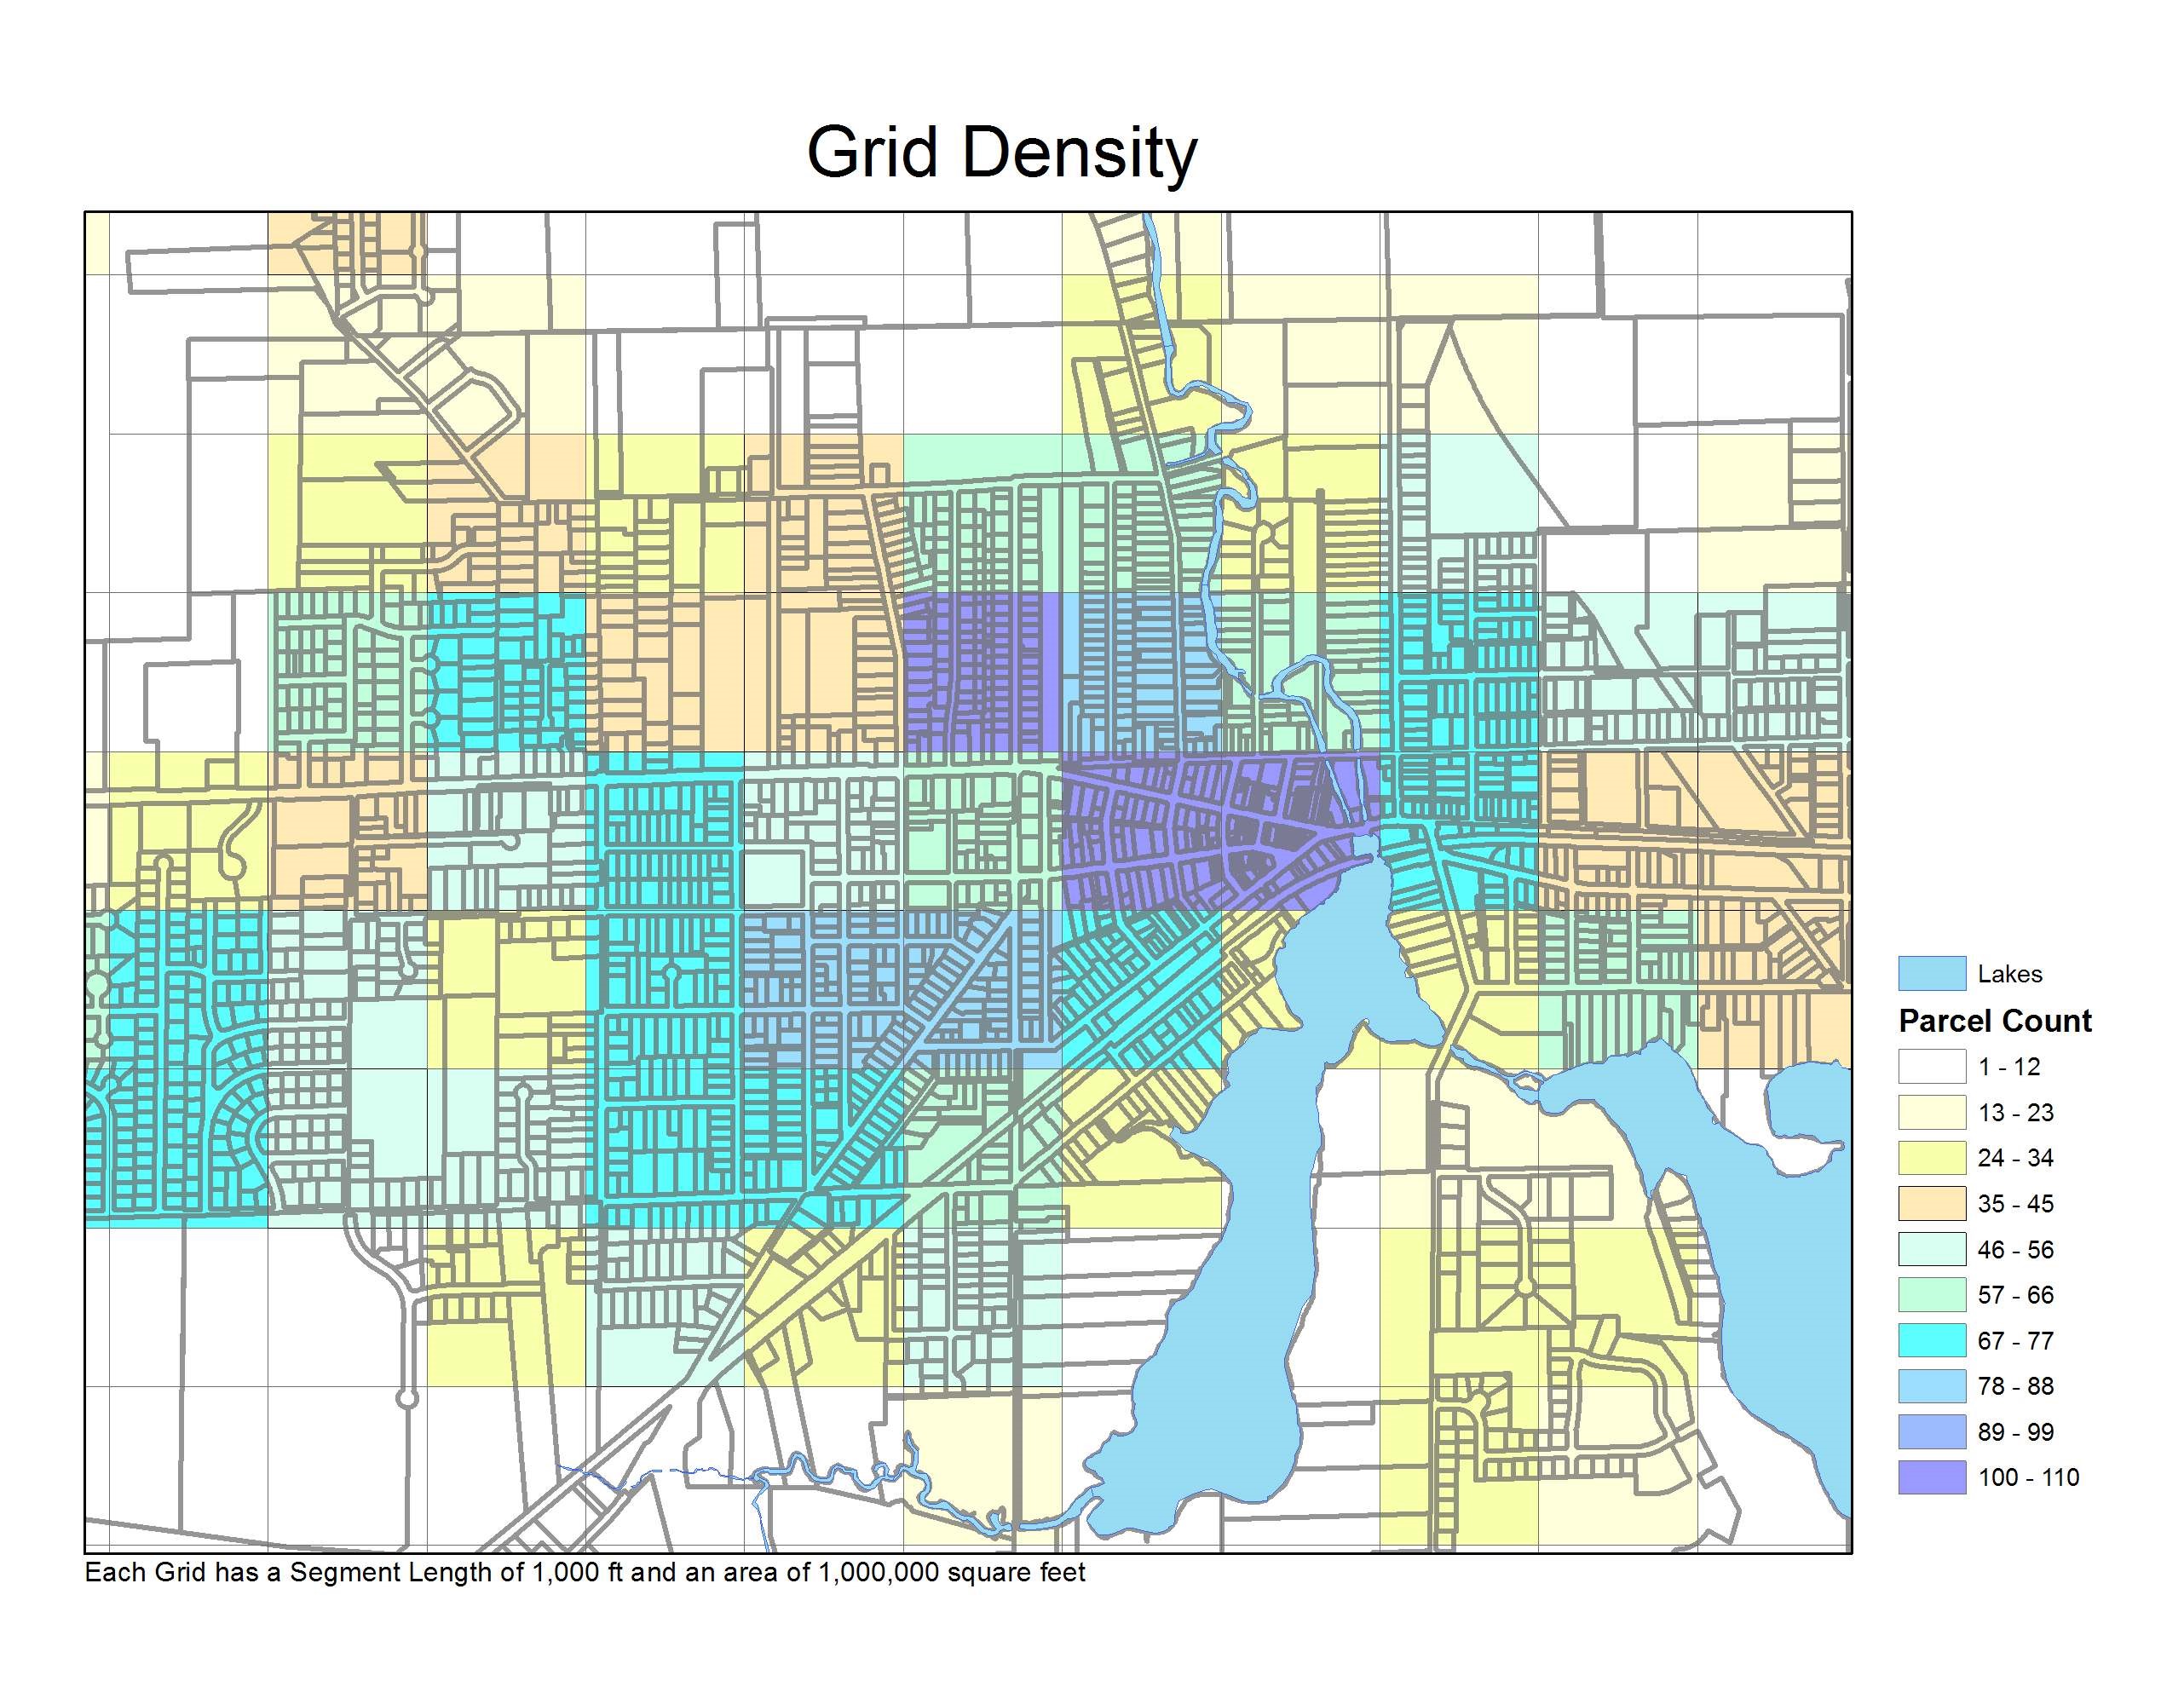
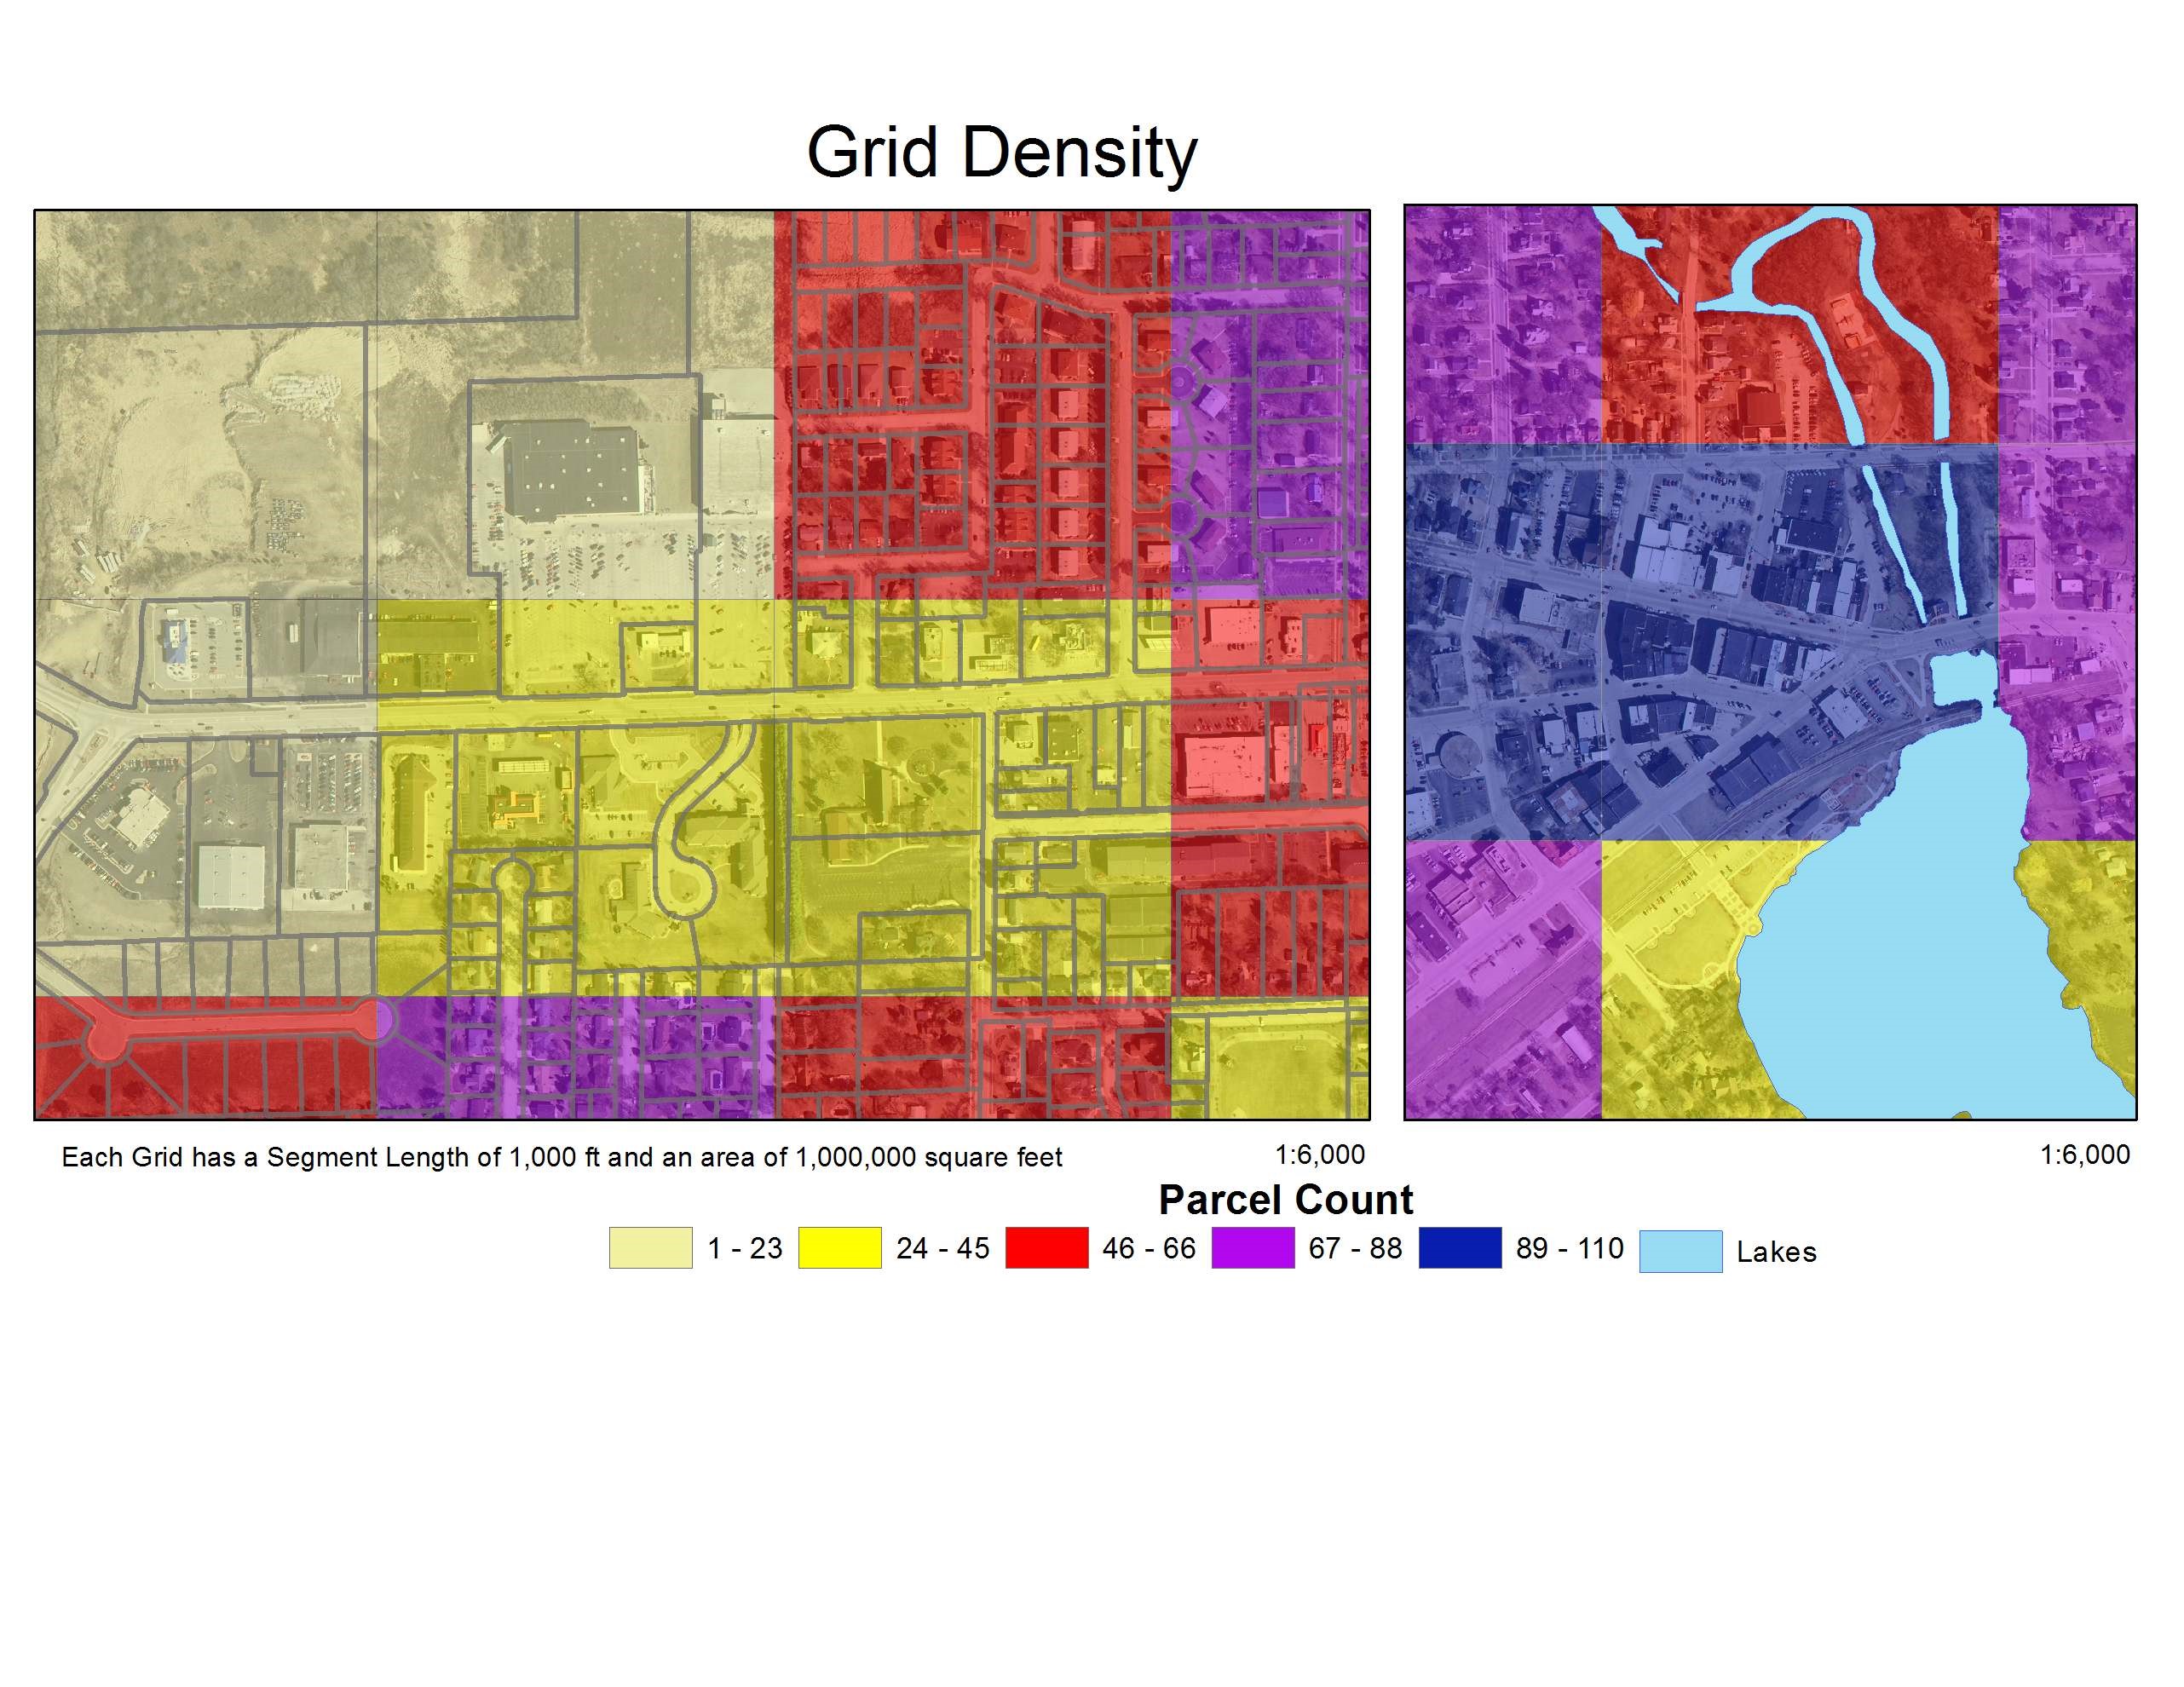
Maps:


Footnotes:
[1] https://www.pewresearch.org/internet/fact-sheet/internet-broadband/?tabId=tab-9a15d0d3-3bff-4e9e-a329-6e328bc7bcce
[2] https://doc.arcgis.com/en/arcgis-solutions/latest/reference/introduction-to-broadband-outreach.htm
[3] https://transition.fcc.gov/national-broadband-plan/broadband-performance-paper.pdf
[4] Electronic Records Filing System: https://apps.psc.wi.gov/ERF/
[5] https://stackoverflow.com/questions/25548029/what-is-the-definition-of-cardinality-in-sql
[i] Export to PostGIS:
https://gis.stackexchange.com/questions/194714/exporting-shapefiles-from-qgis-to-postgis
[1] How to Import ESRI Geodatabase format .gdb into PostGIS: https://gis.stackexchange.com/questions/83016/how-to-import-esri-geodatabase-format-gdb-into-postgis
[2] GDAL ogr2ogr: https://gdal.org/programs/ogr2ogr.html#examples
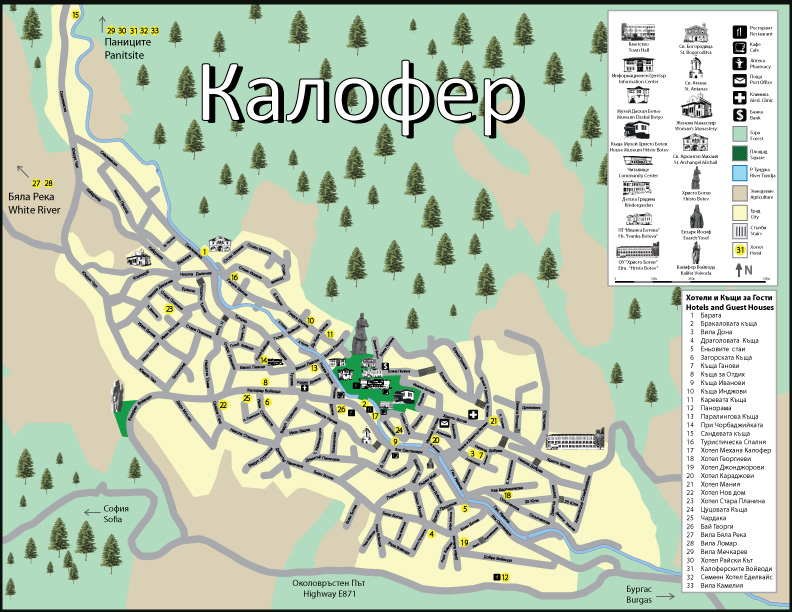
Tourist Map – Peace Corps Bulgaria:
The following map was made during my service in the Peace Corps. Tourist information board in the center of Kalofer with hotels, museums, and other important attractions and amenities.
Undergraduate: UW-Whitewater Wisconsin
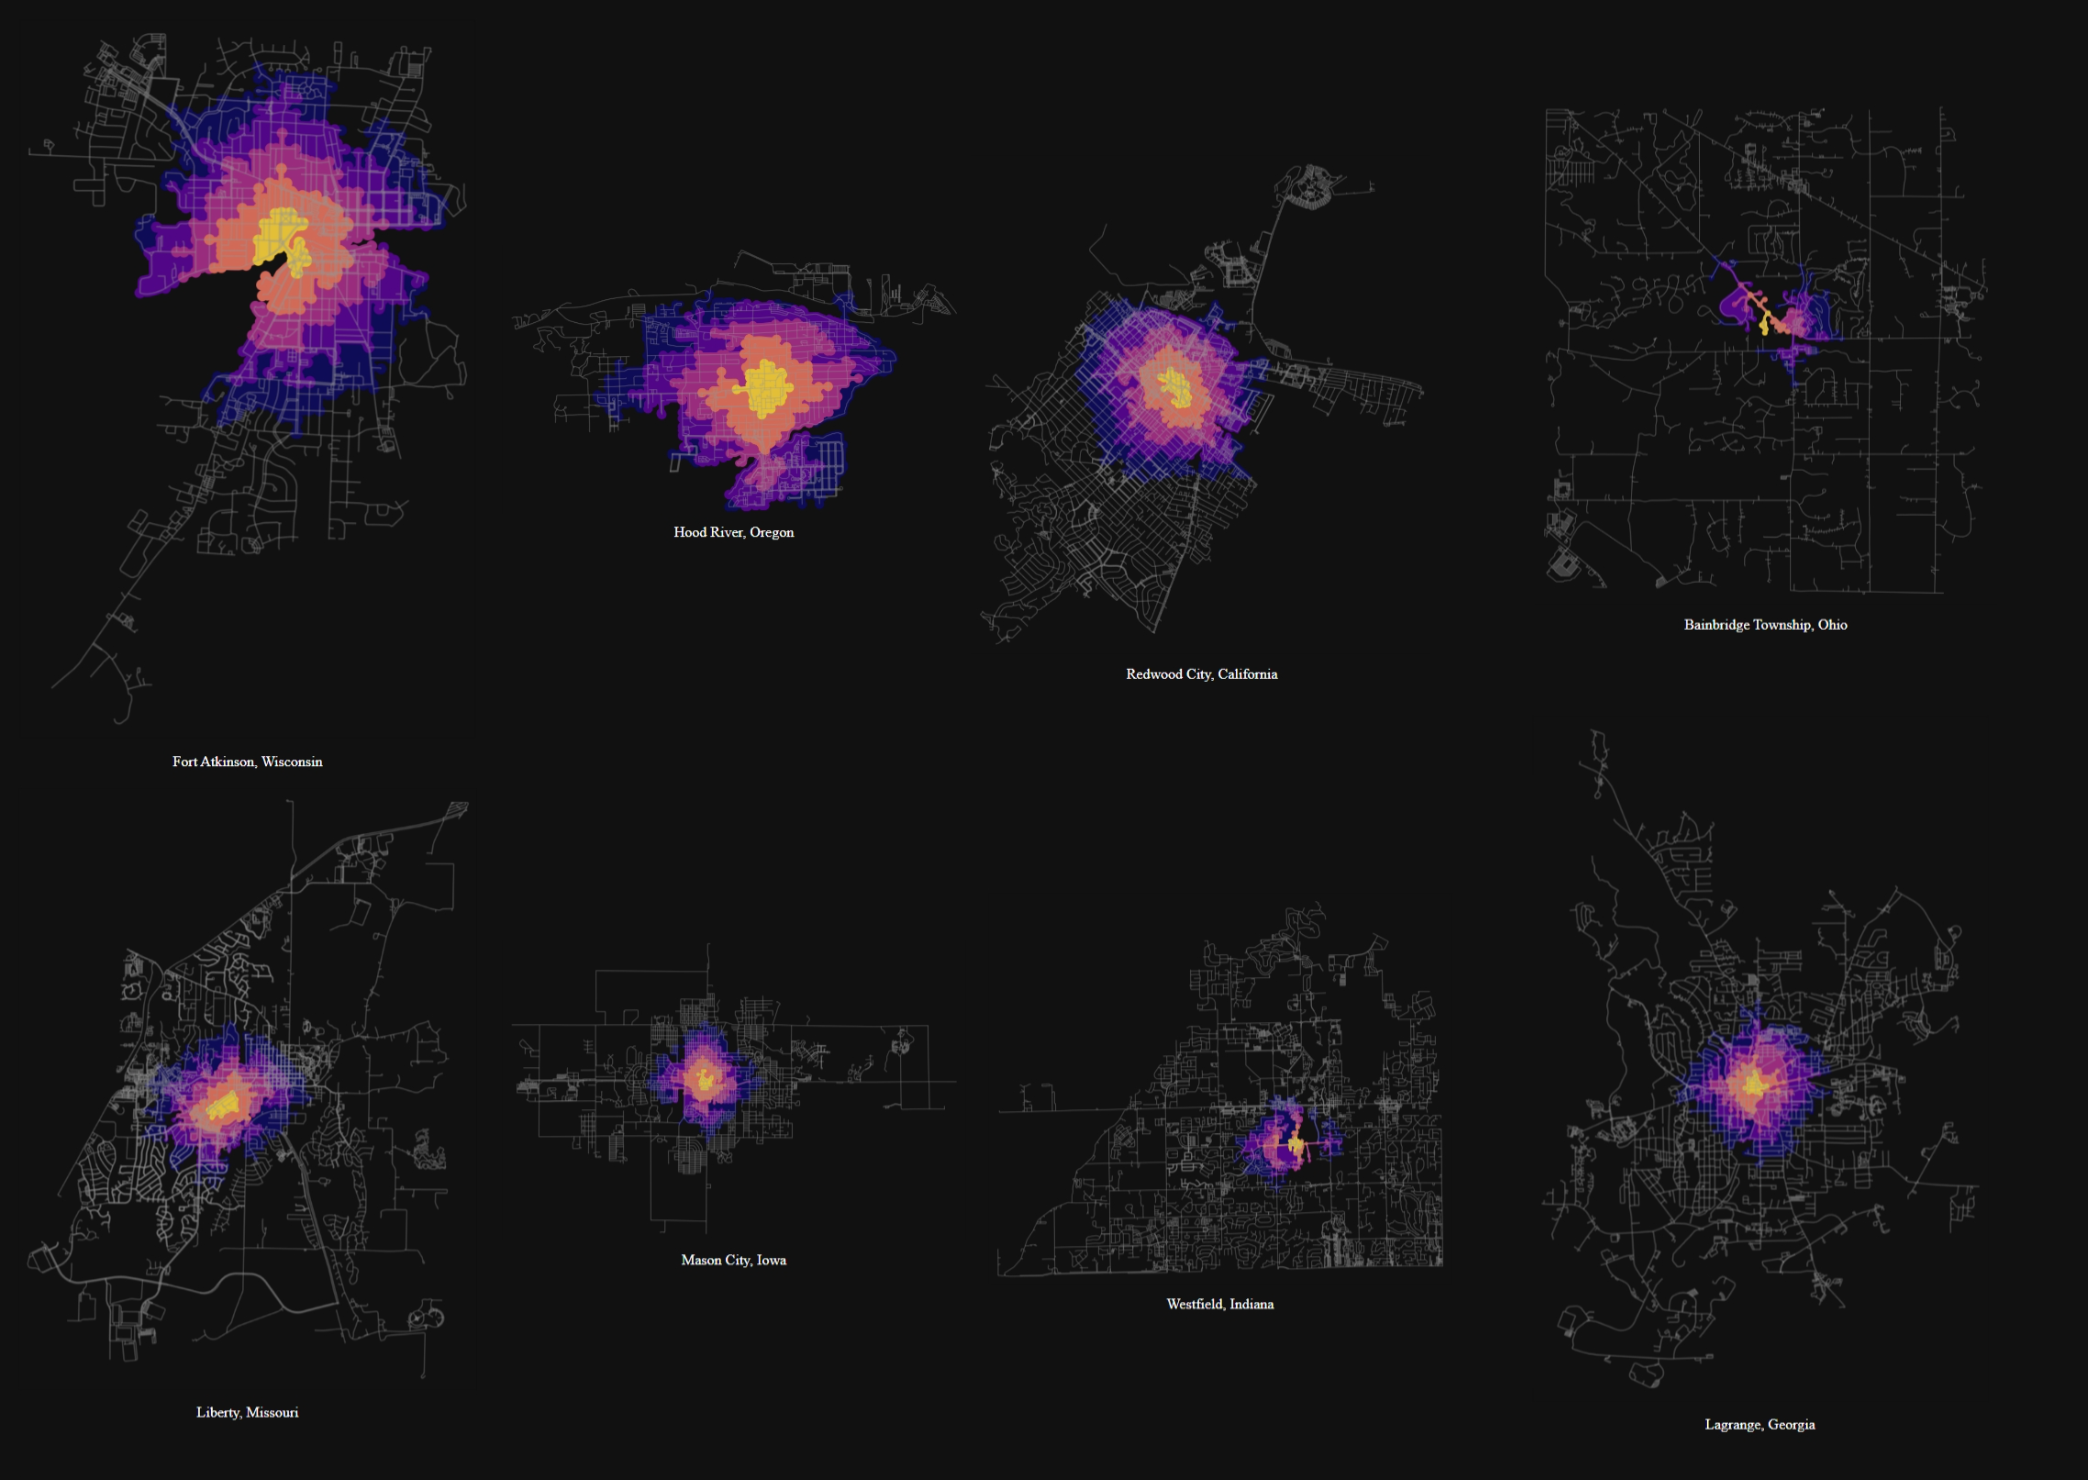
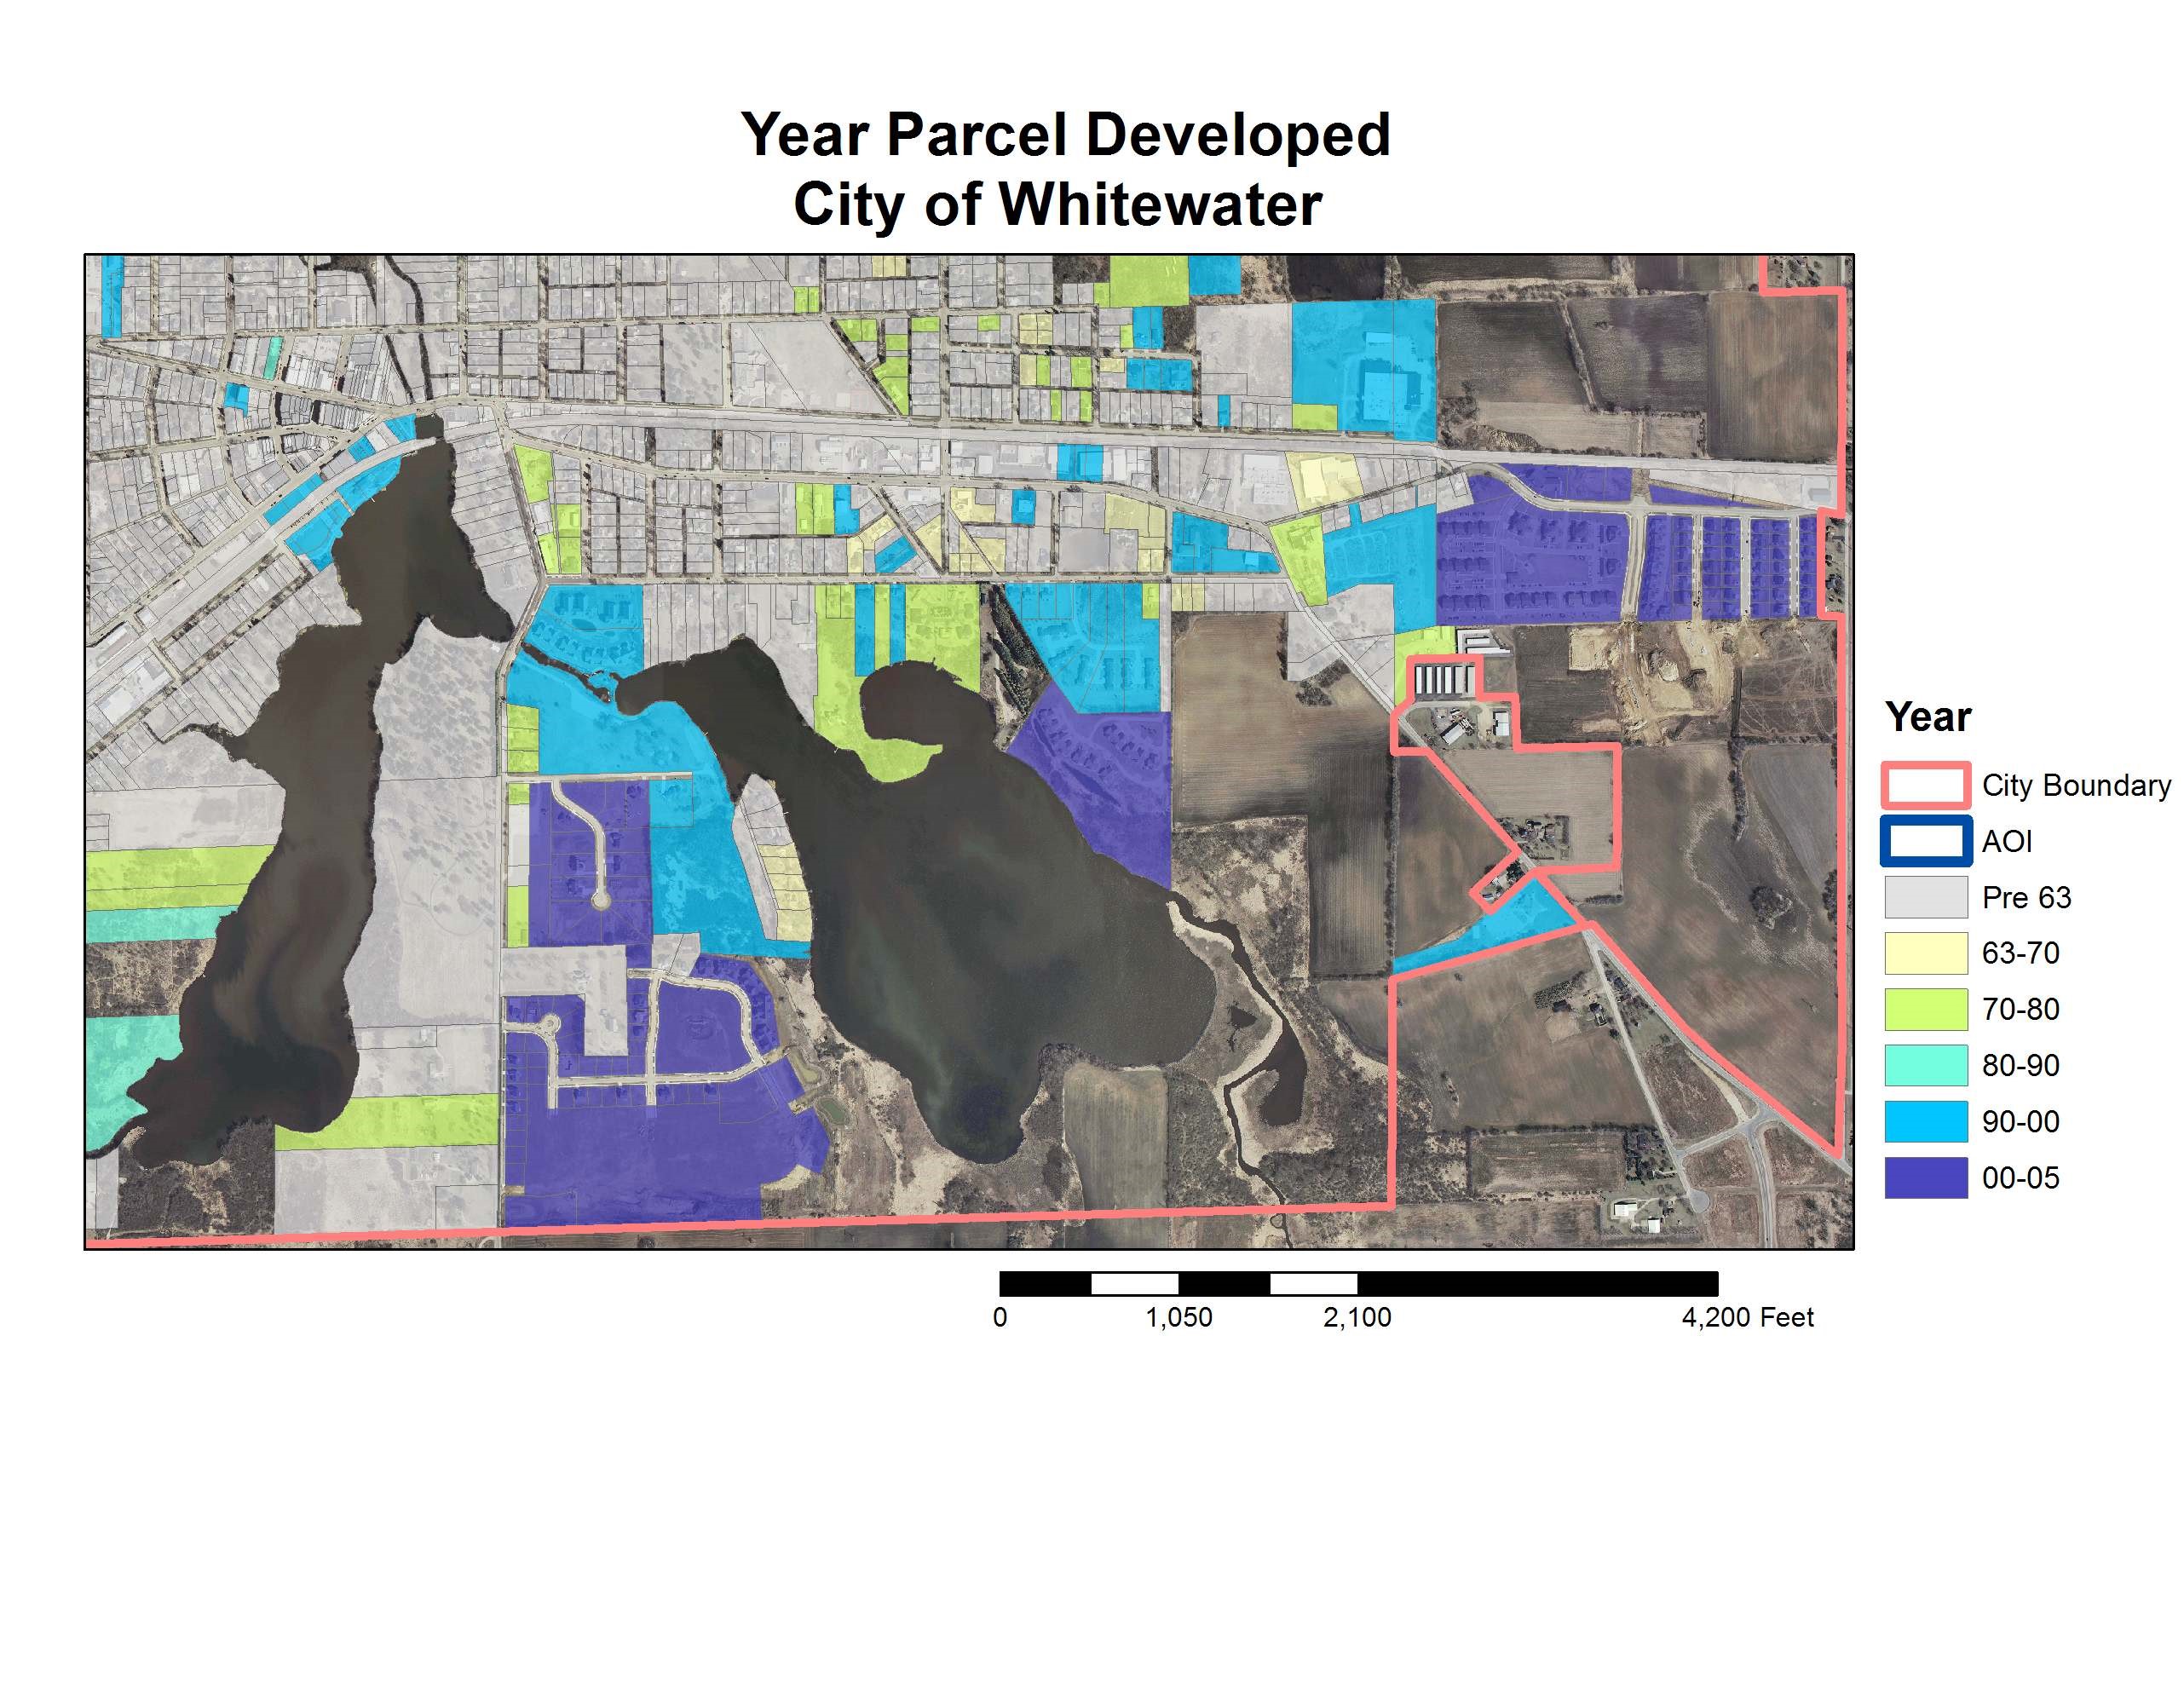
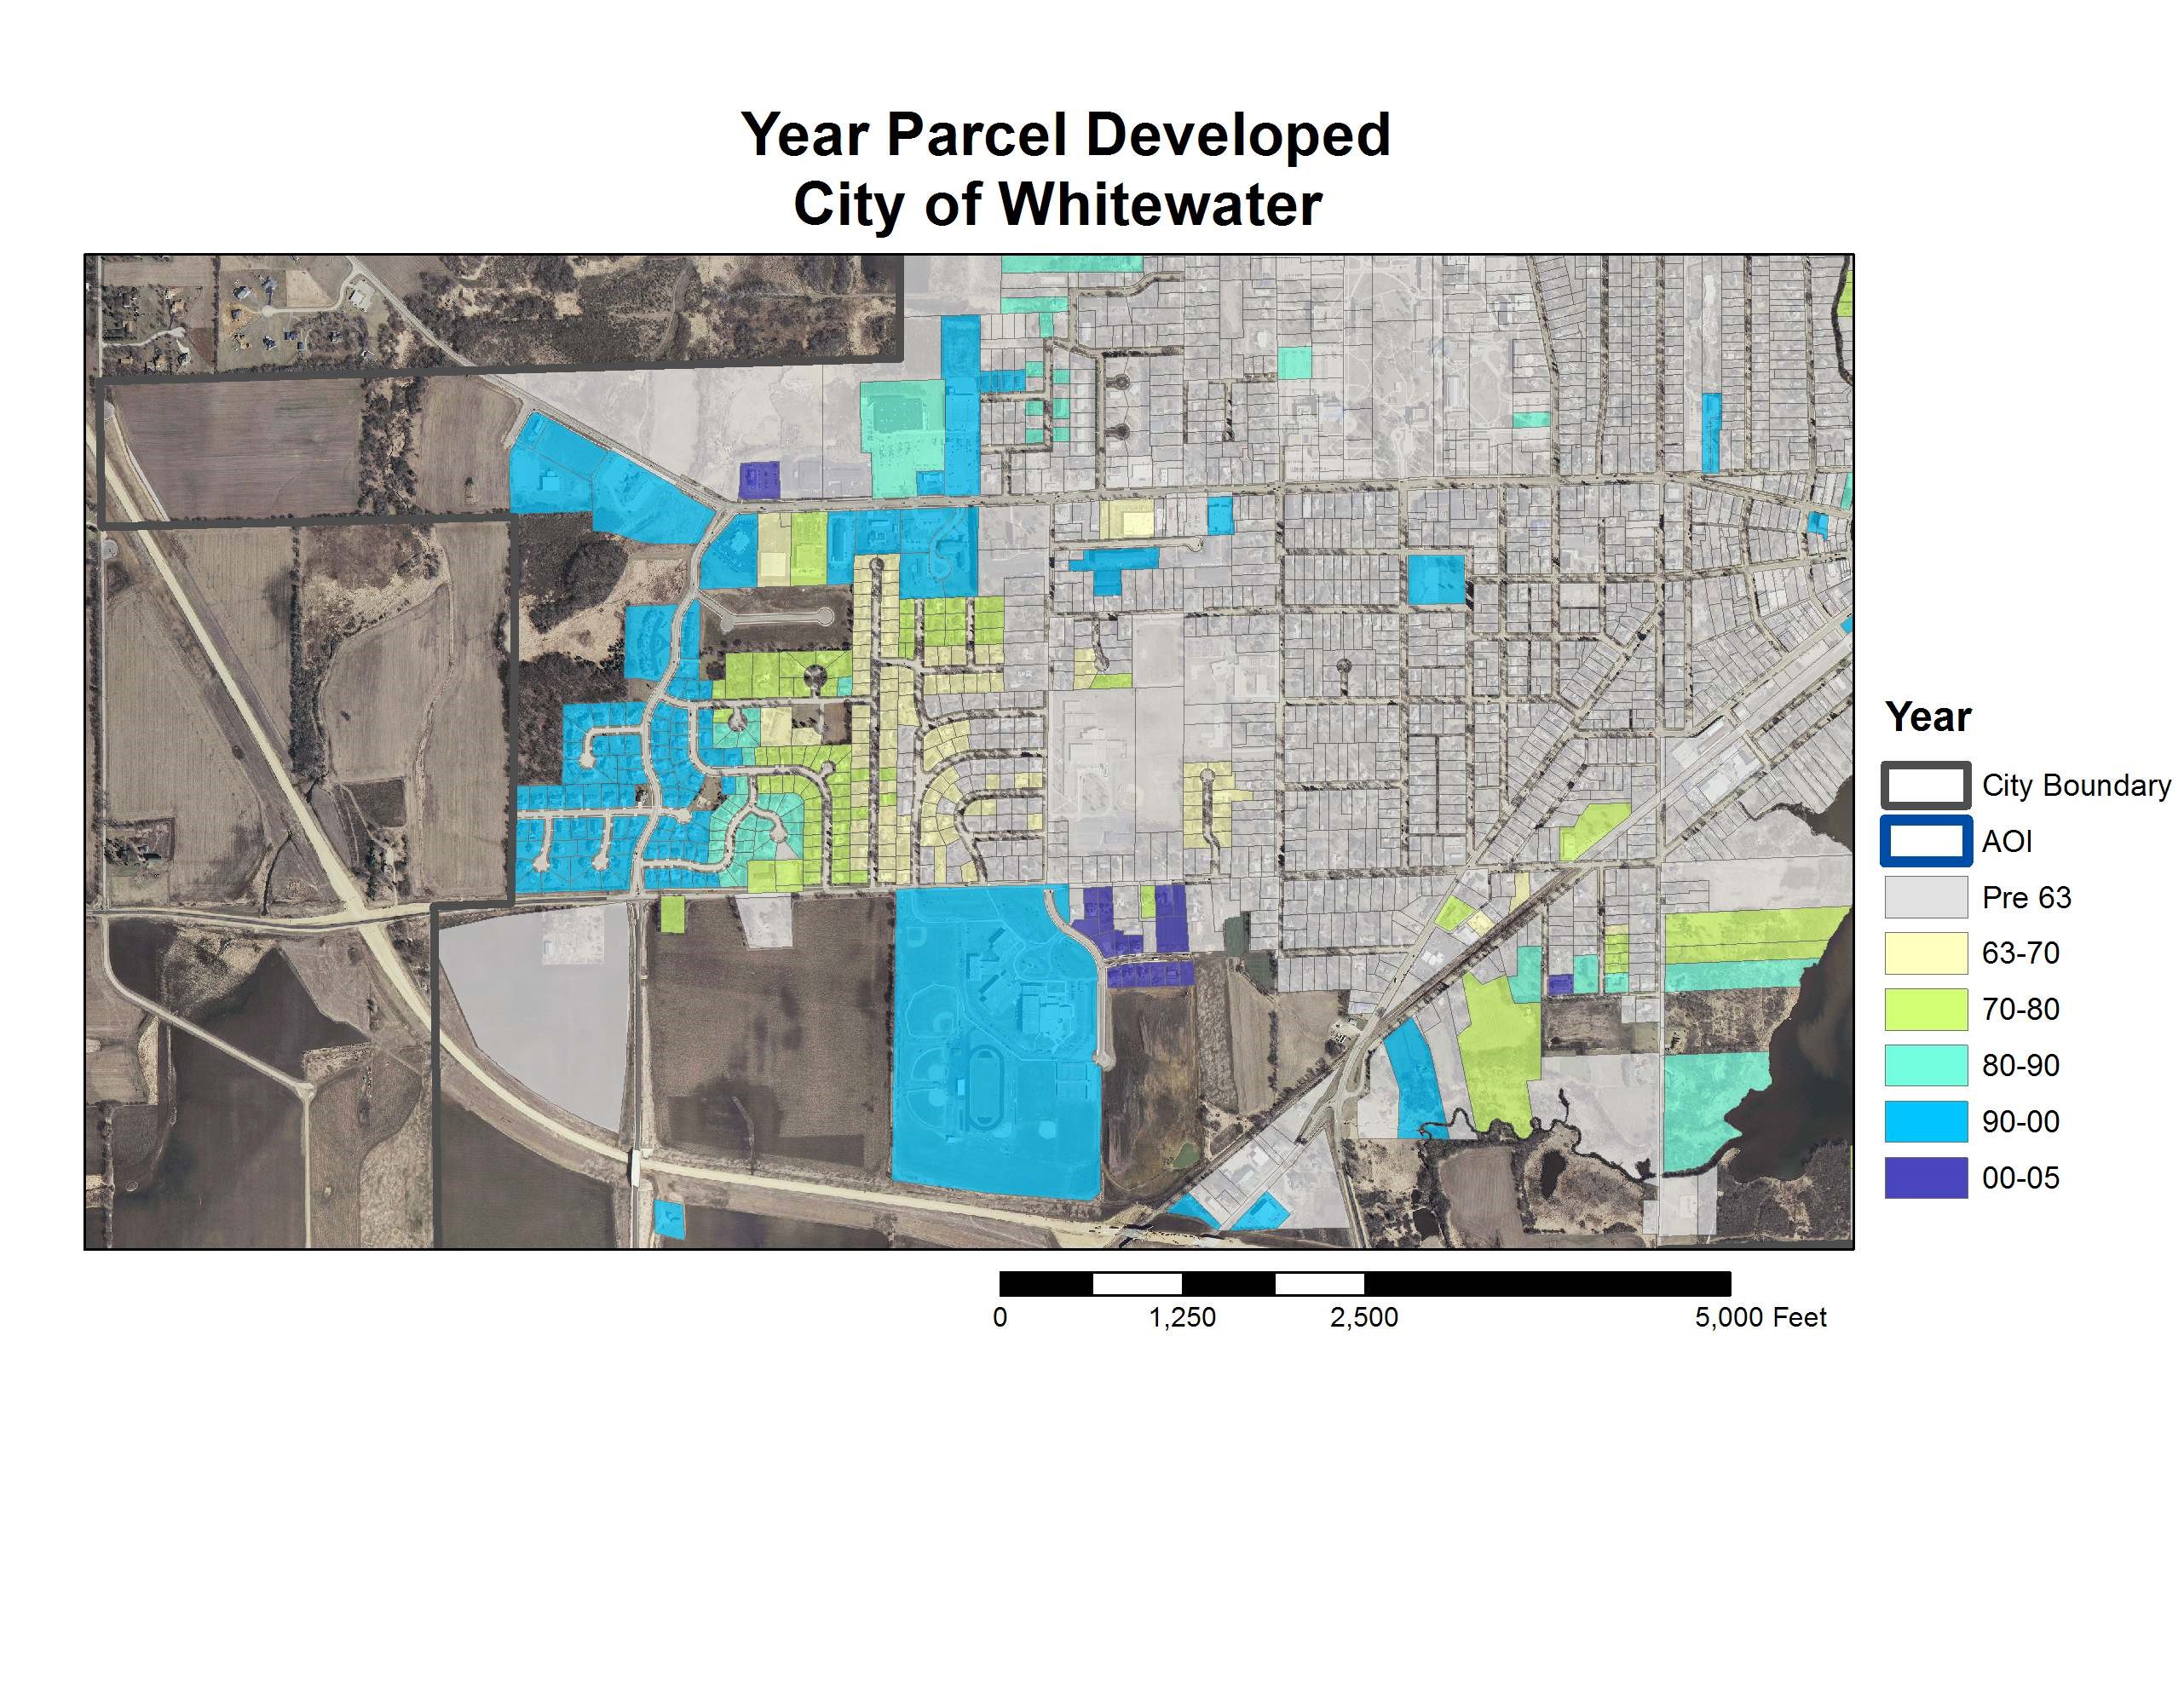
The past century of American history have seen radical changes in the American urban landscape stemming from increased use of and dependency on the automobile. The expansion of the urban footprint in small towns has received much less attention than larger metropolitan areas. My undergraduate research project sought to address that gap in research through a detailed exploration of both changing land use patterns and the expansion of the urban footprint in Whitewater, Wisconsin, through the use of incremental aerial photographs and GIS.
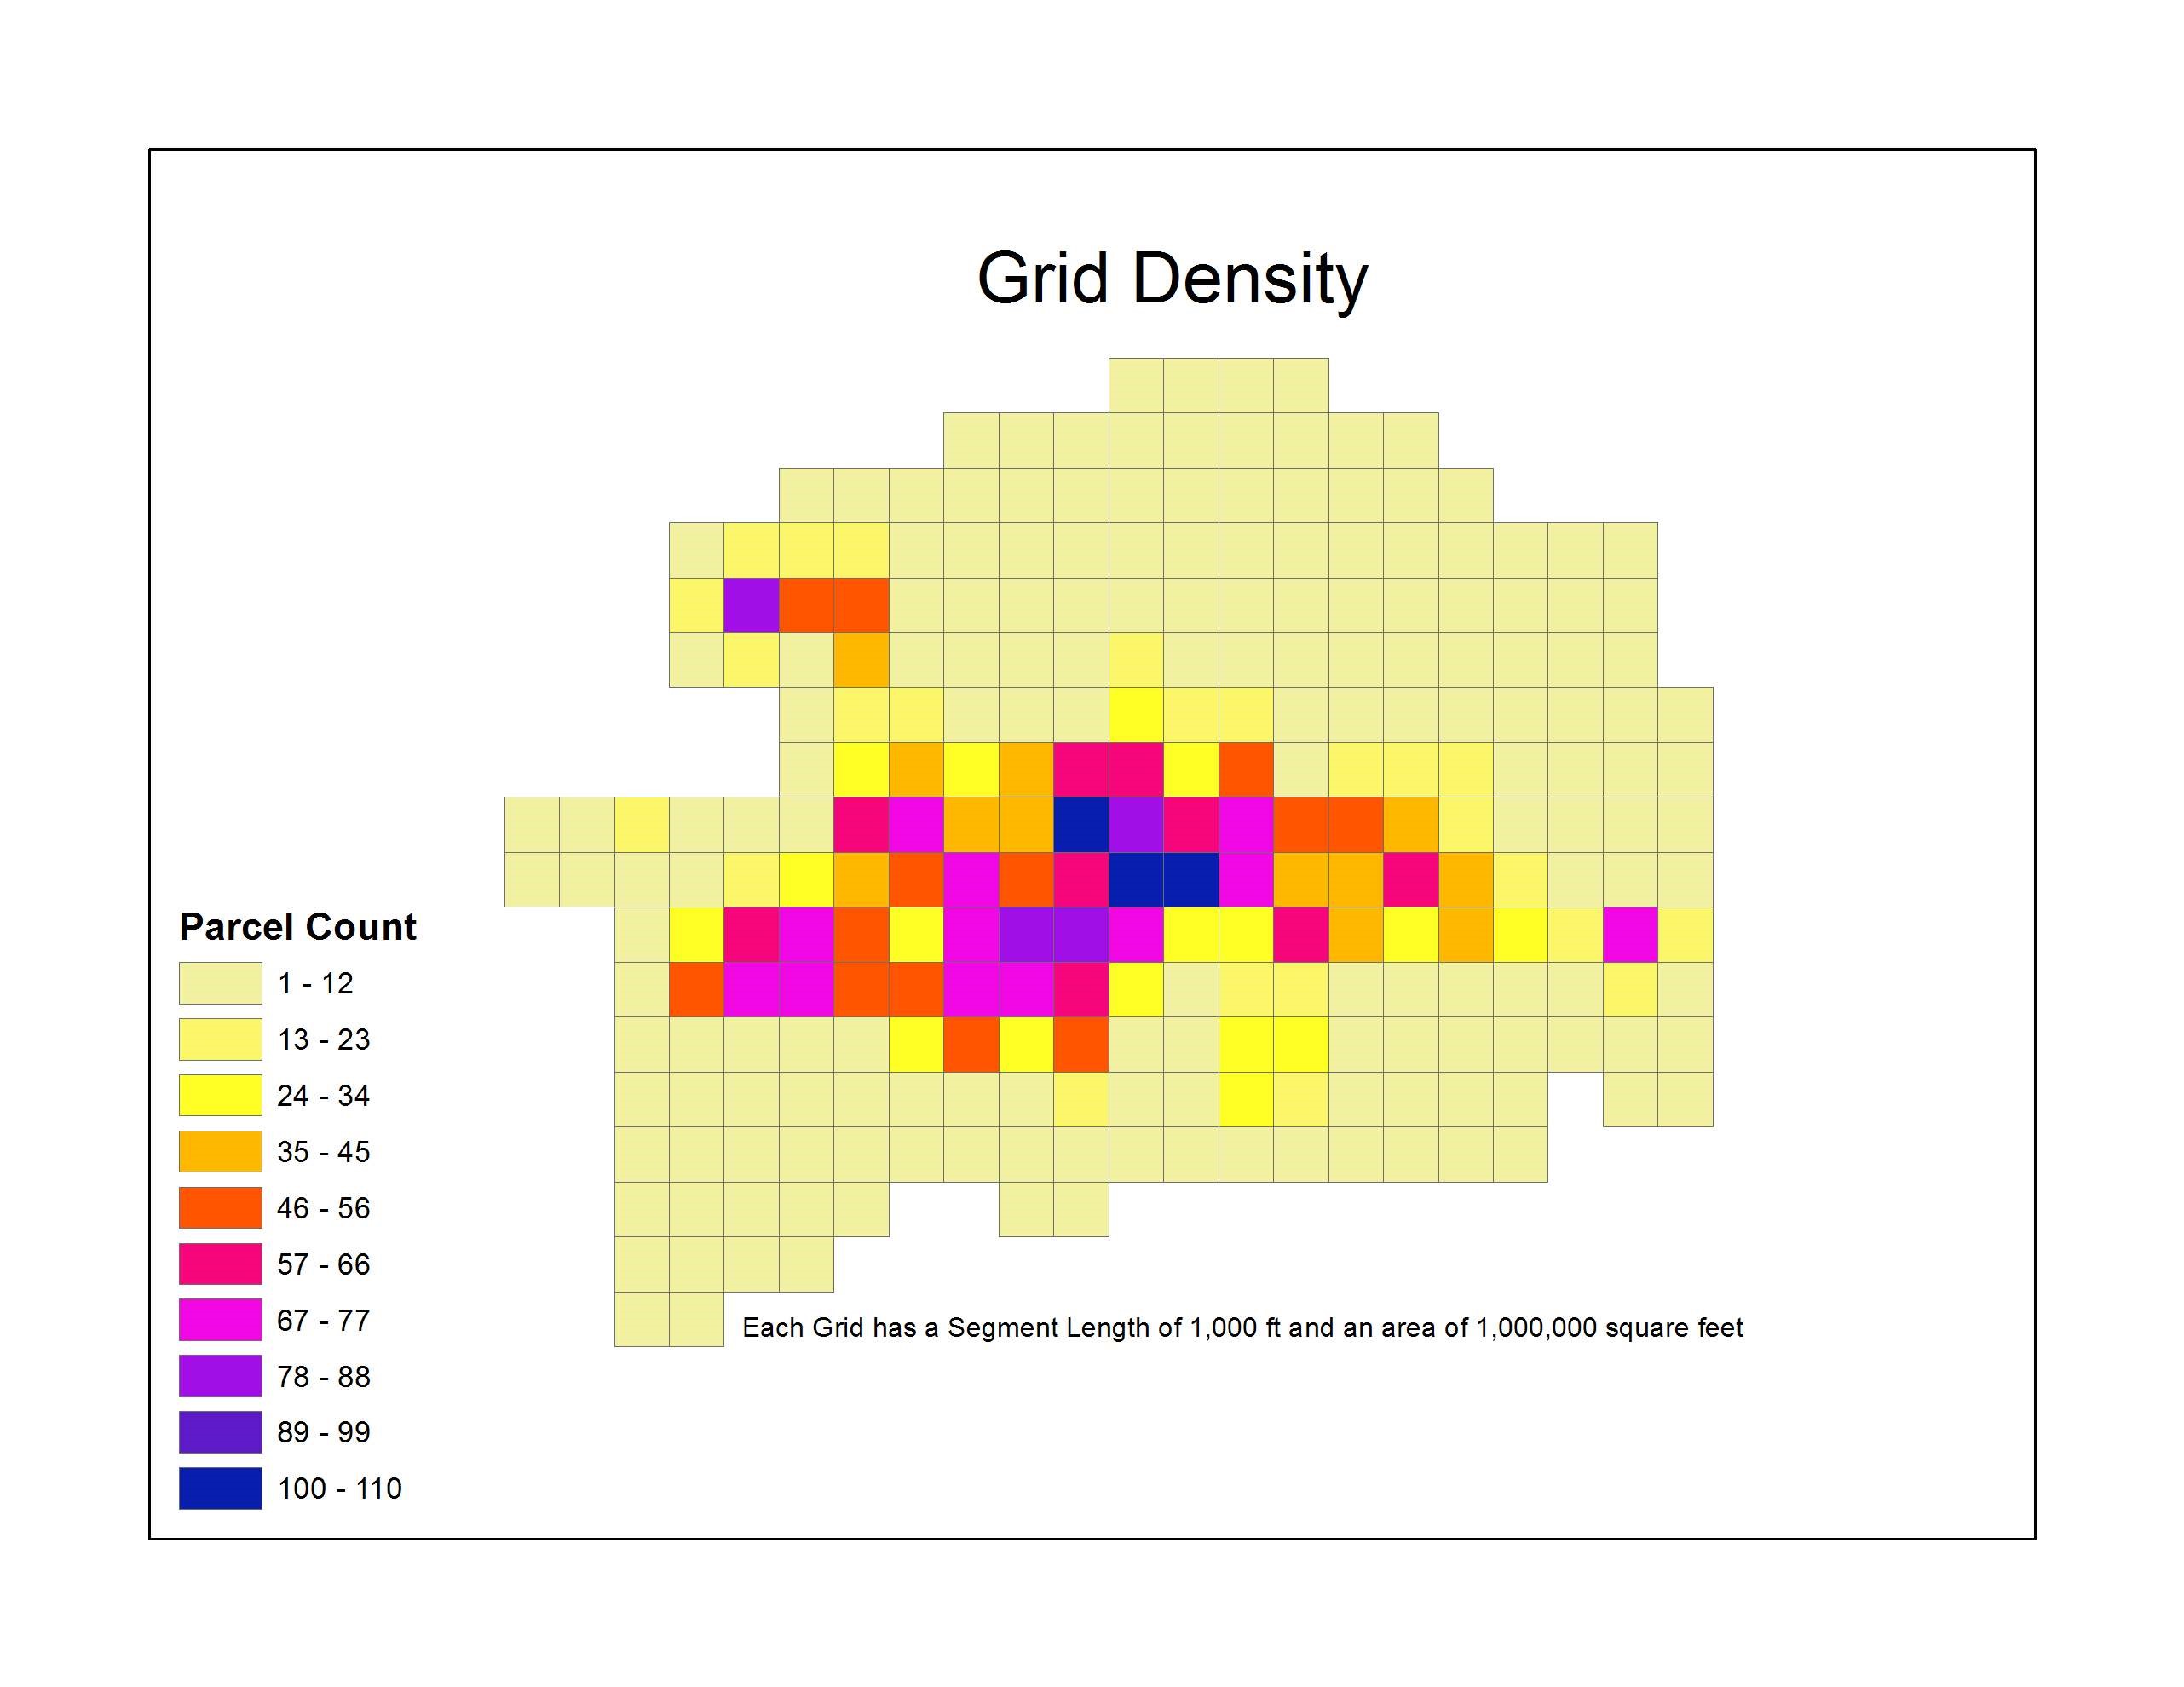

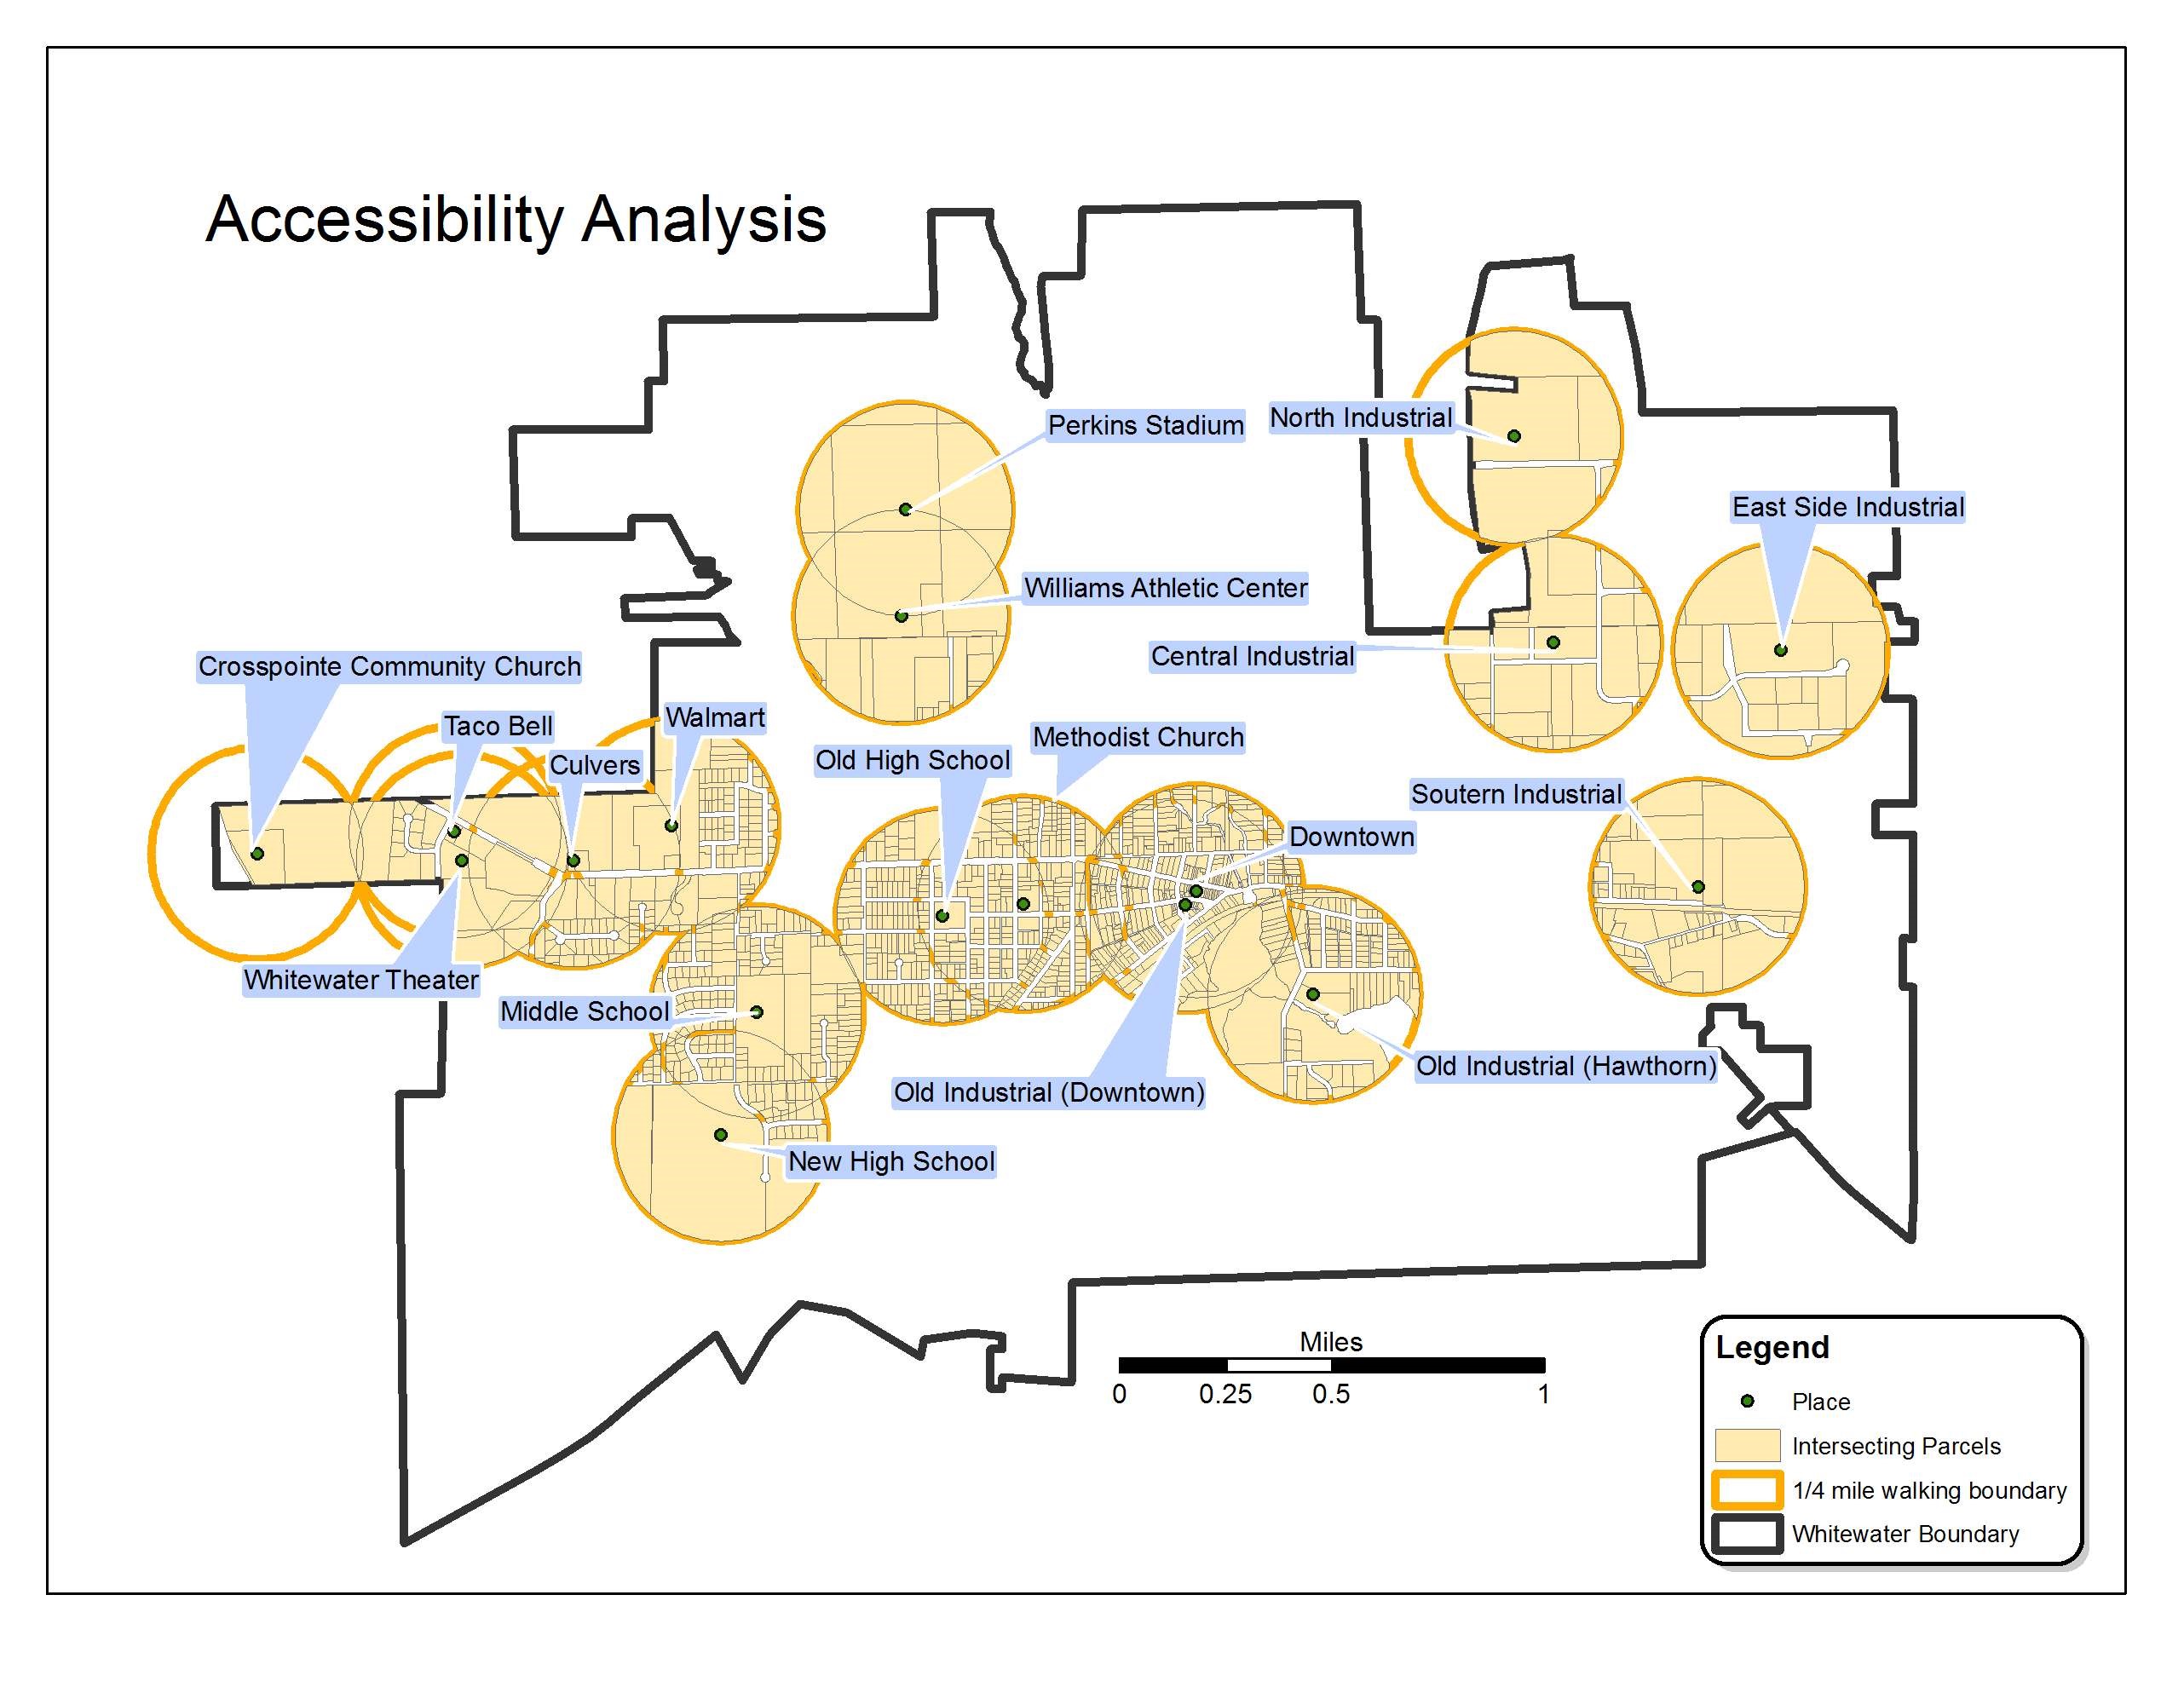
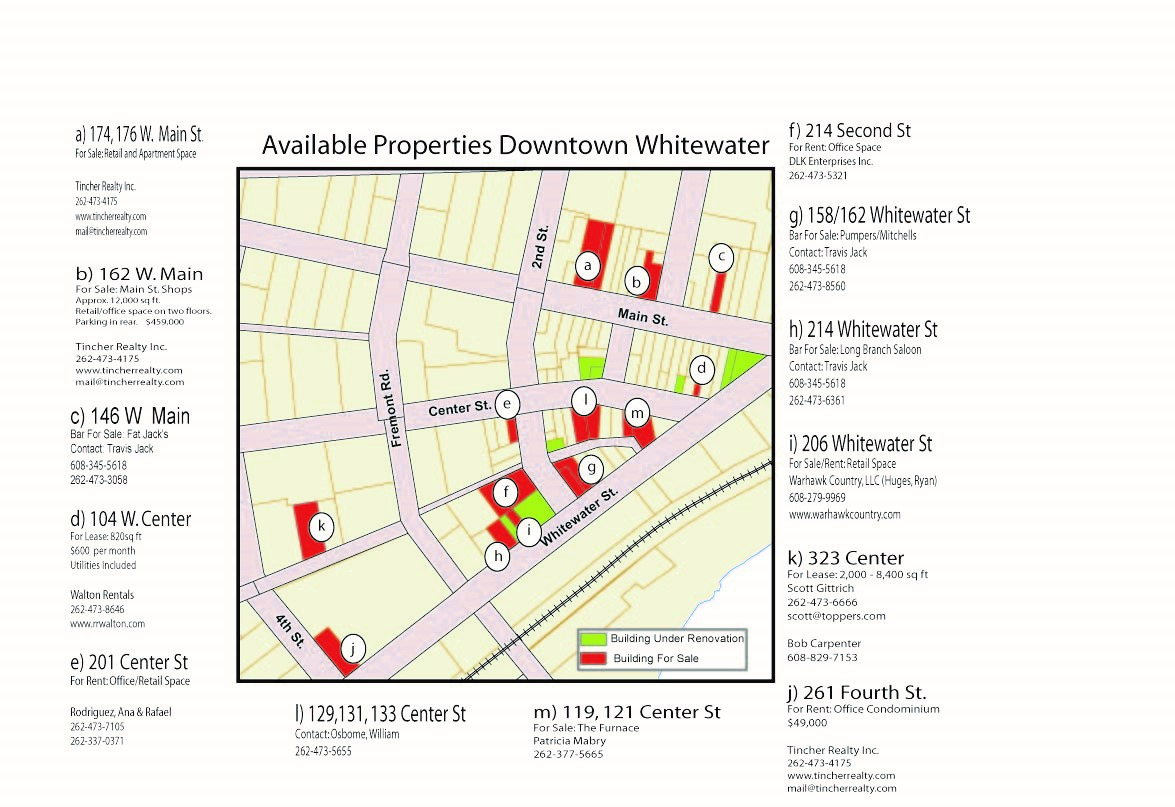
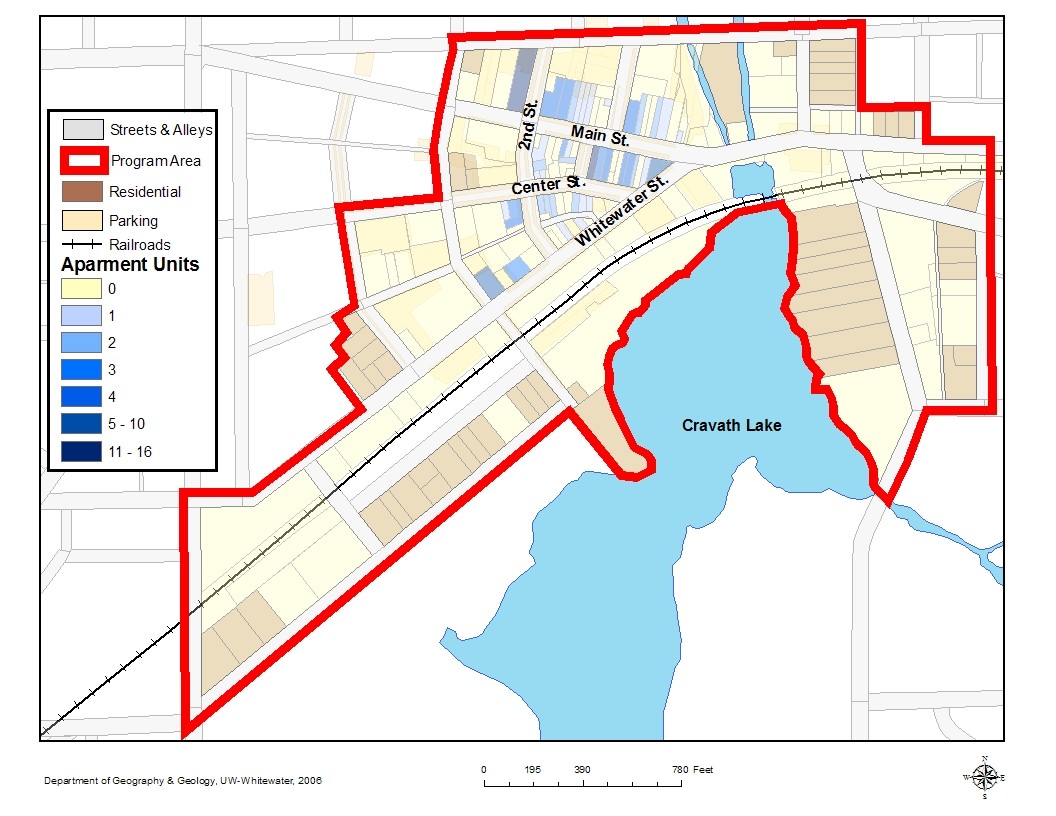

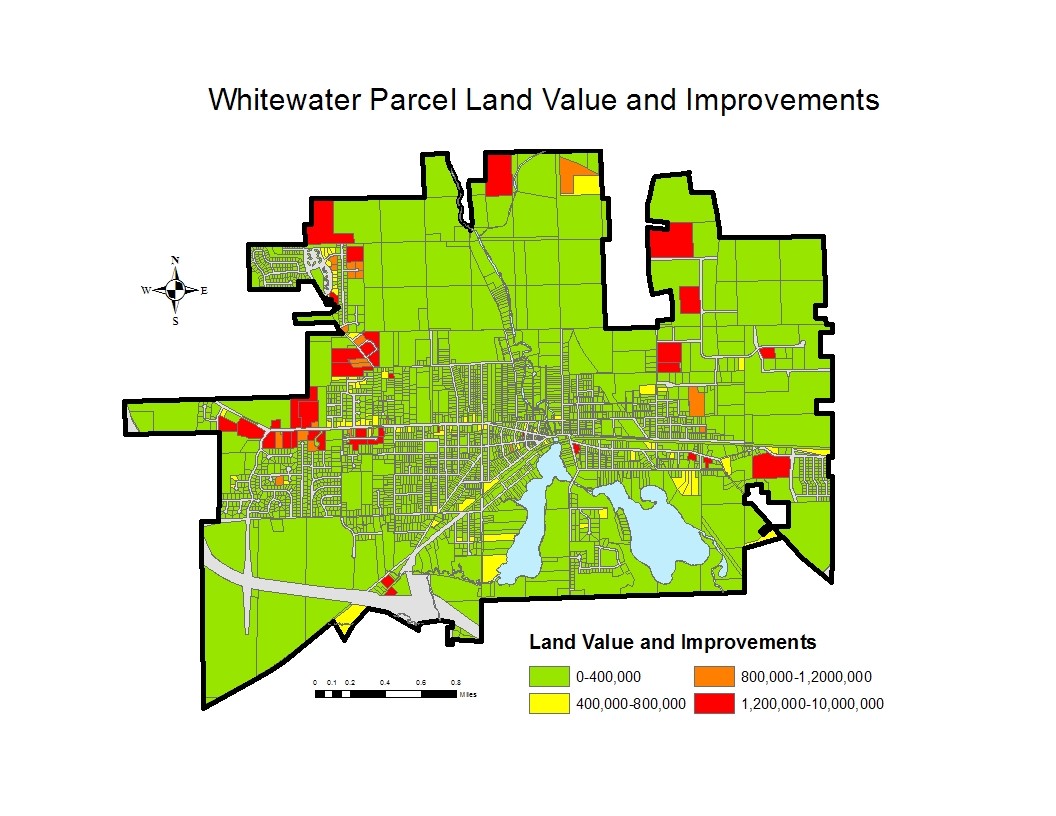
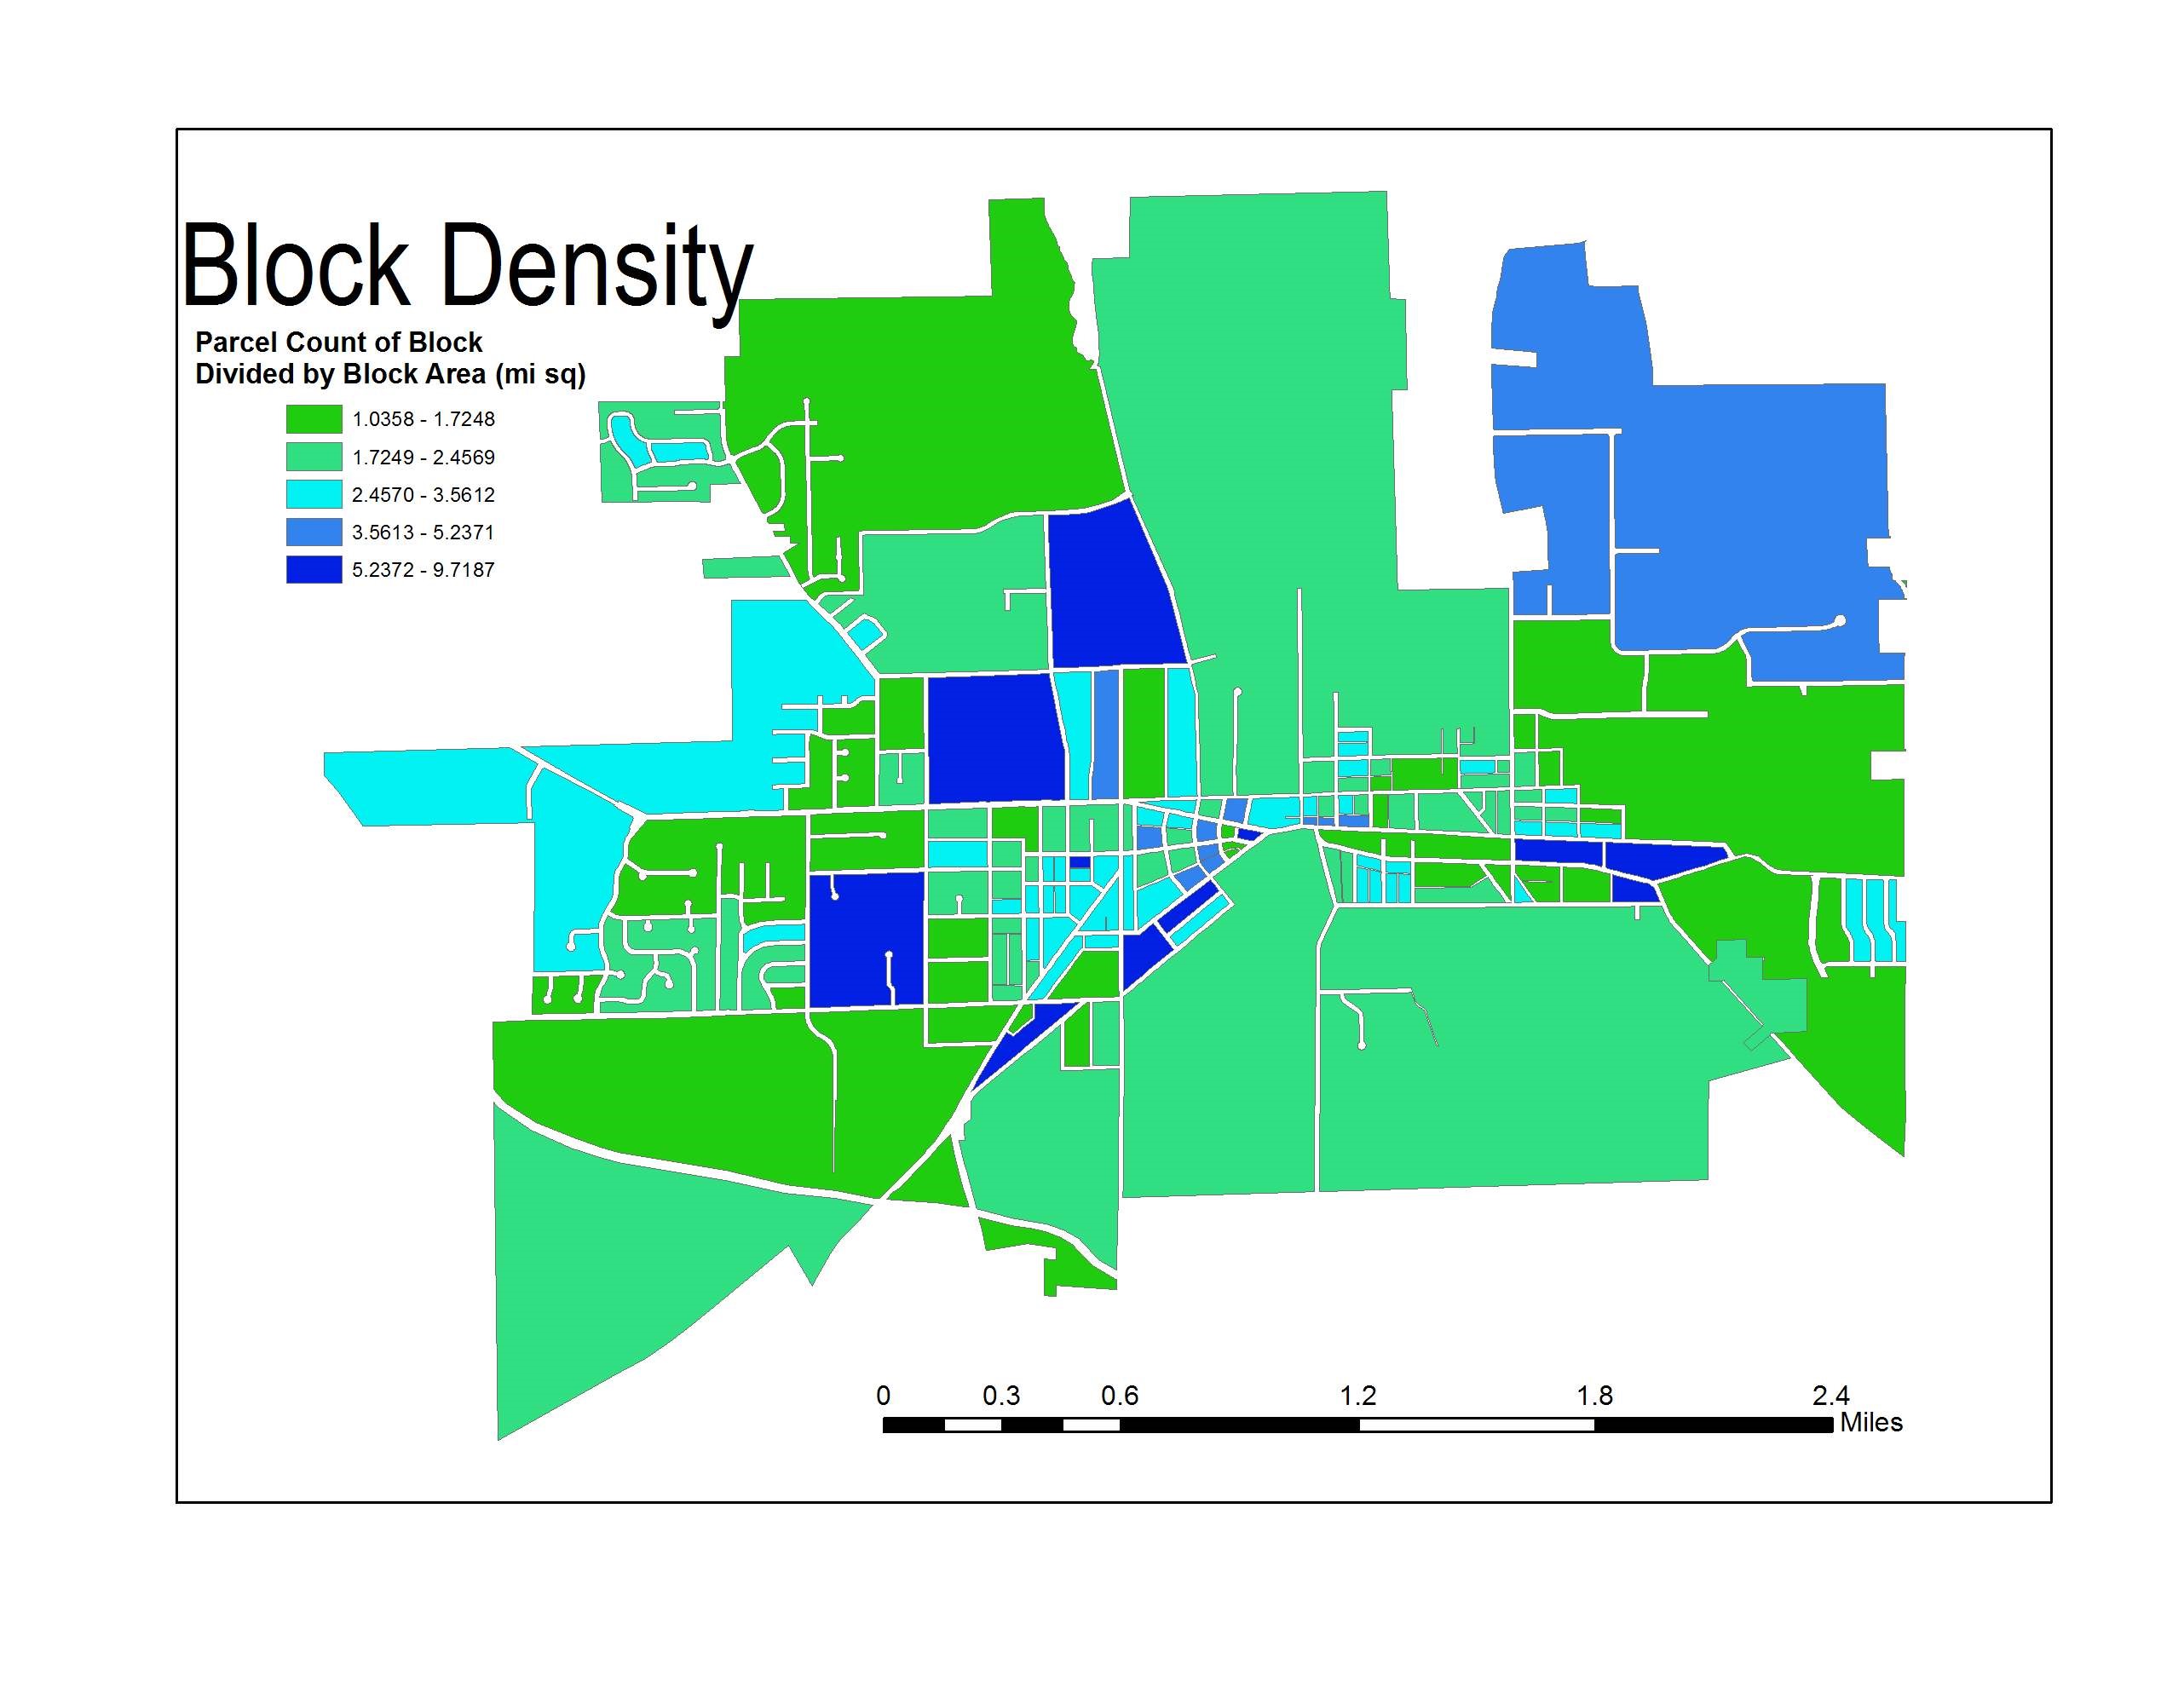
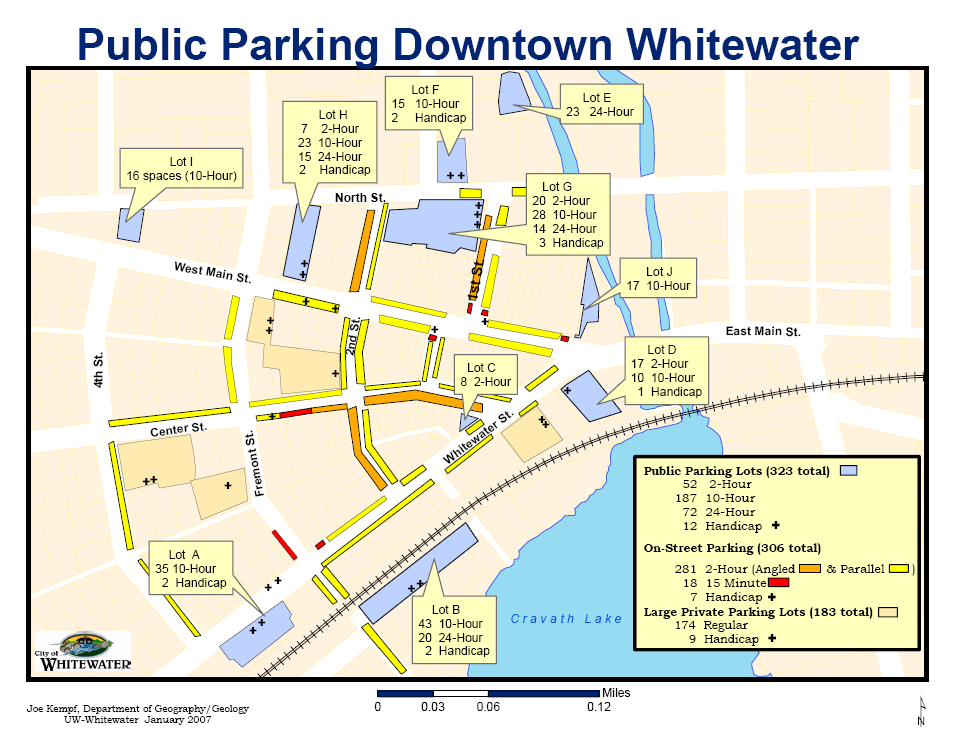
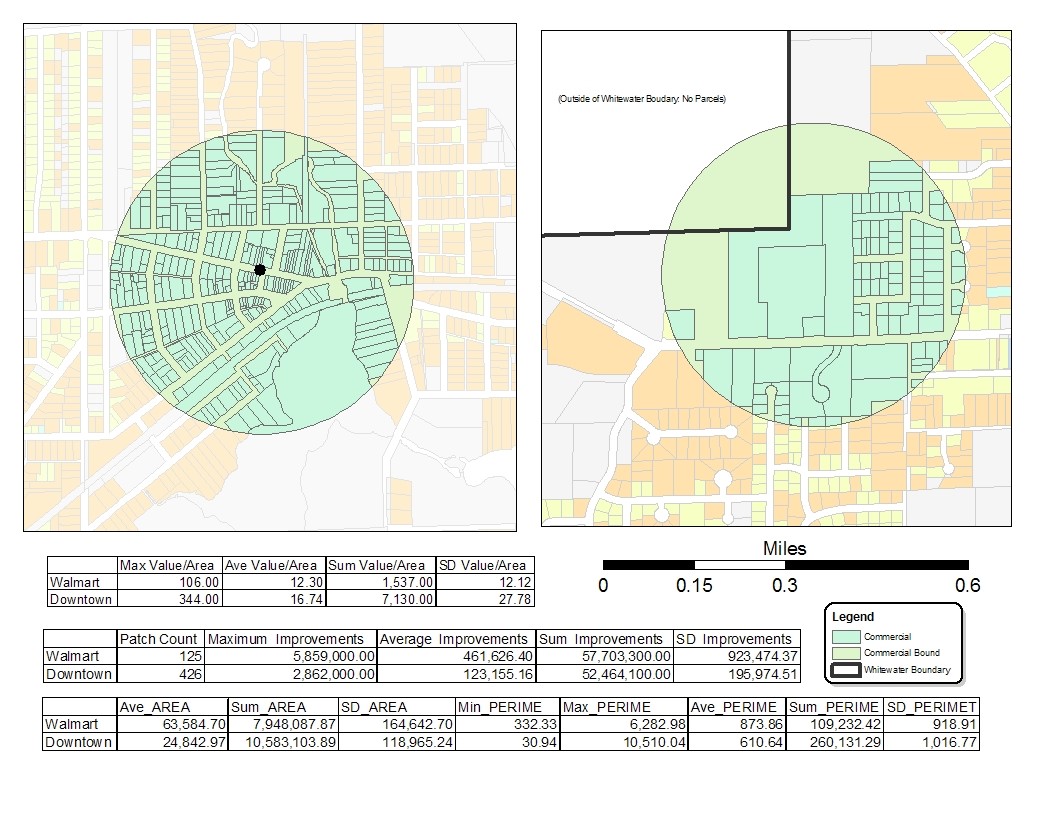


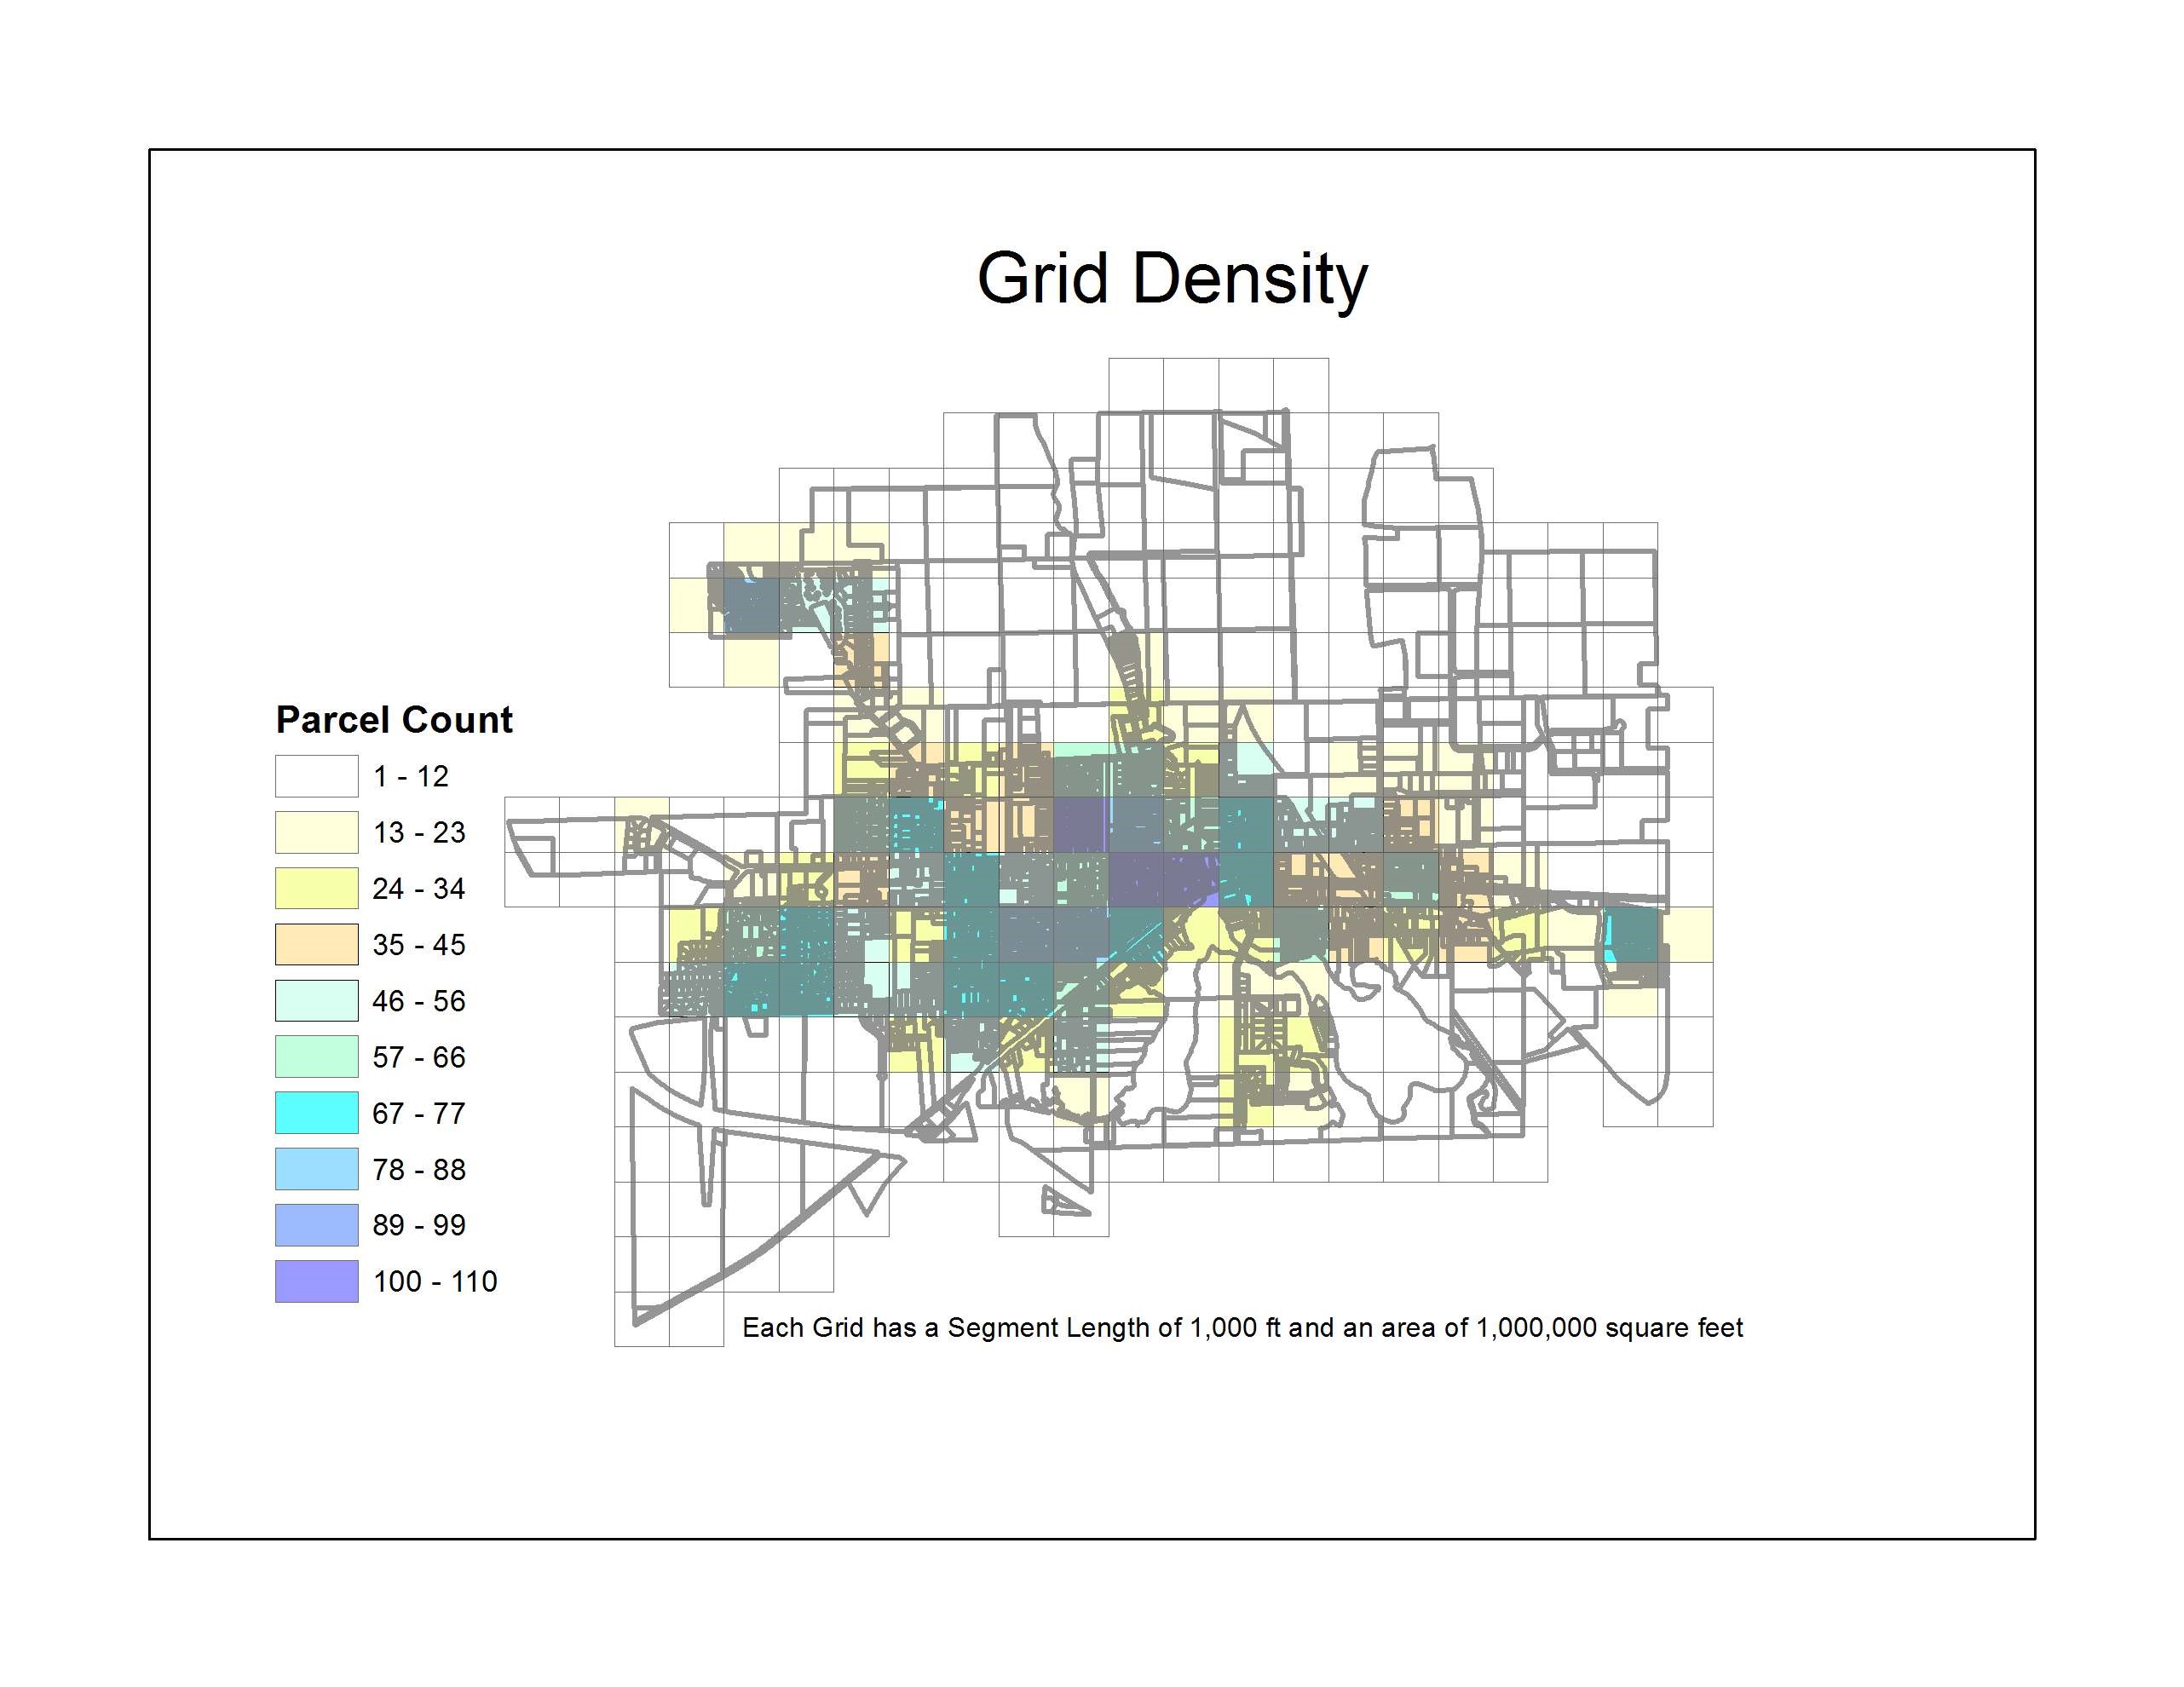
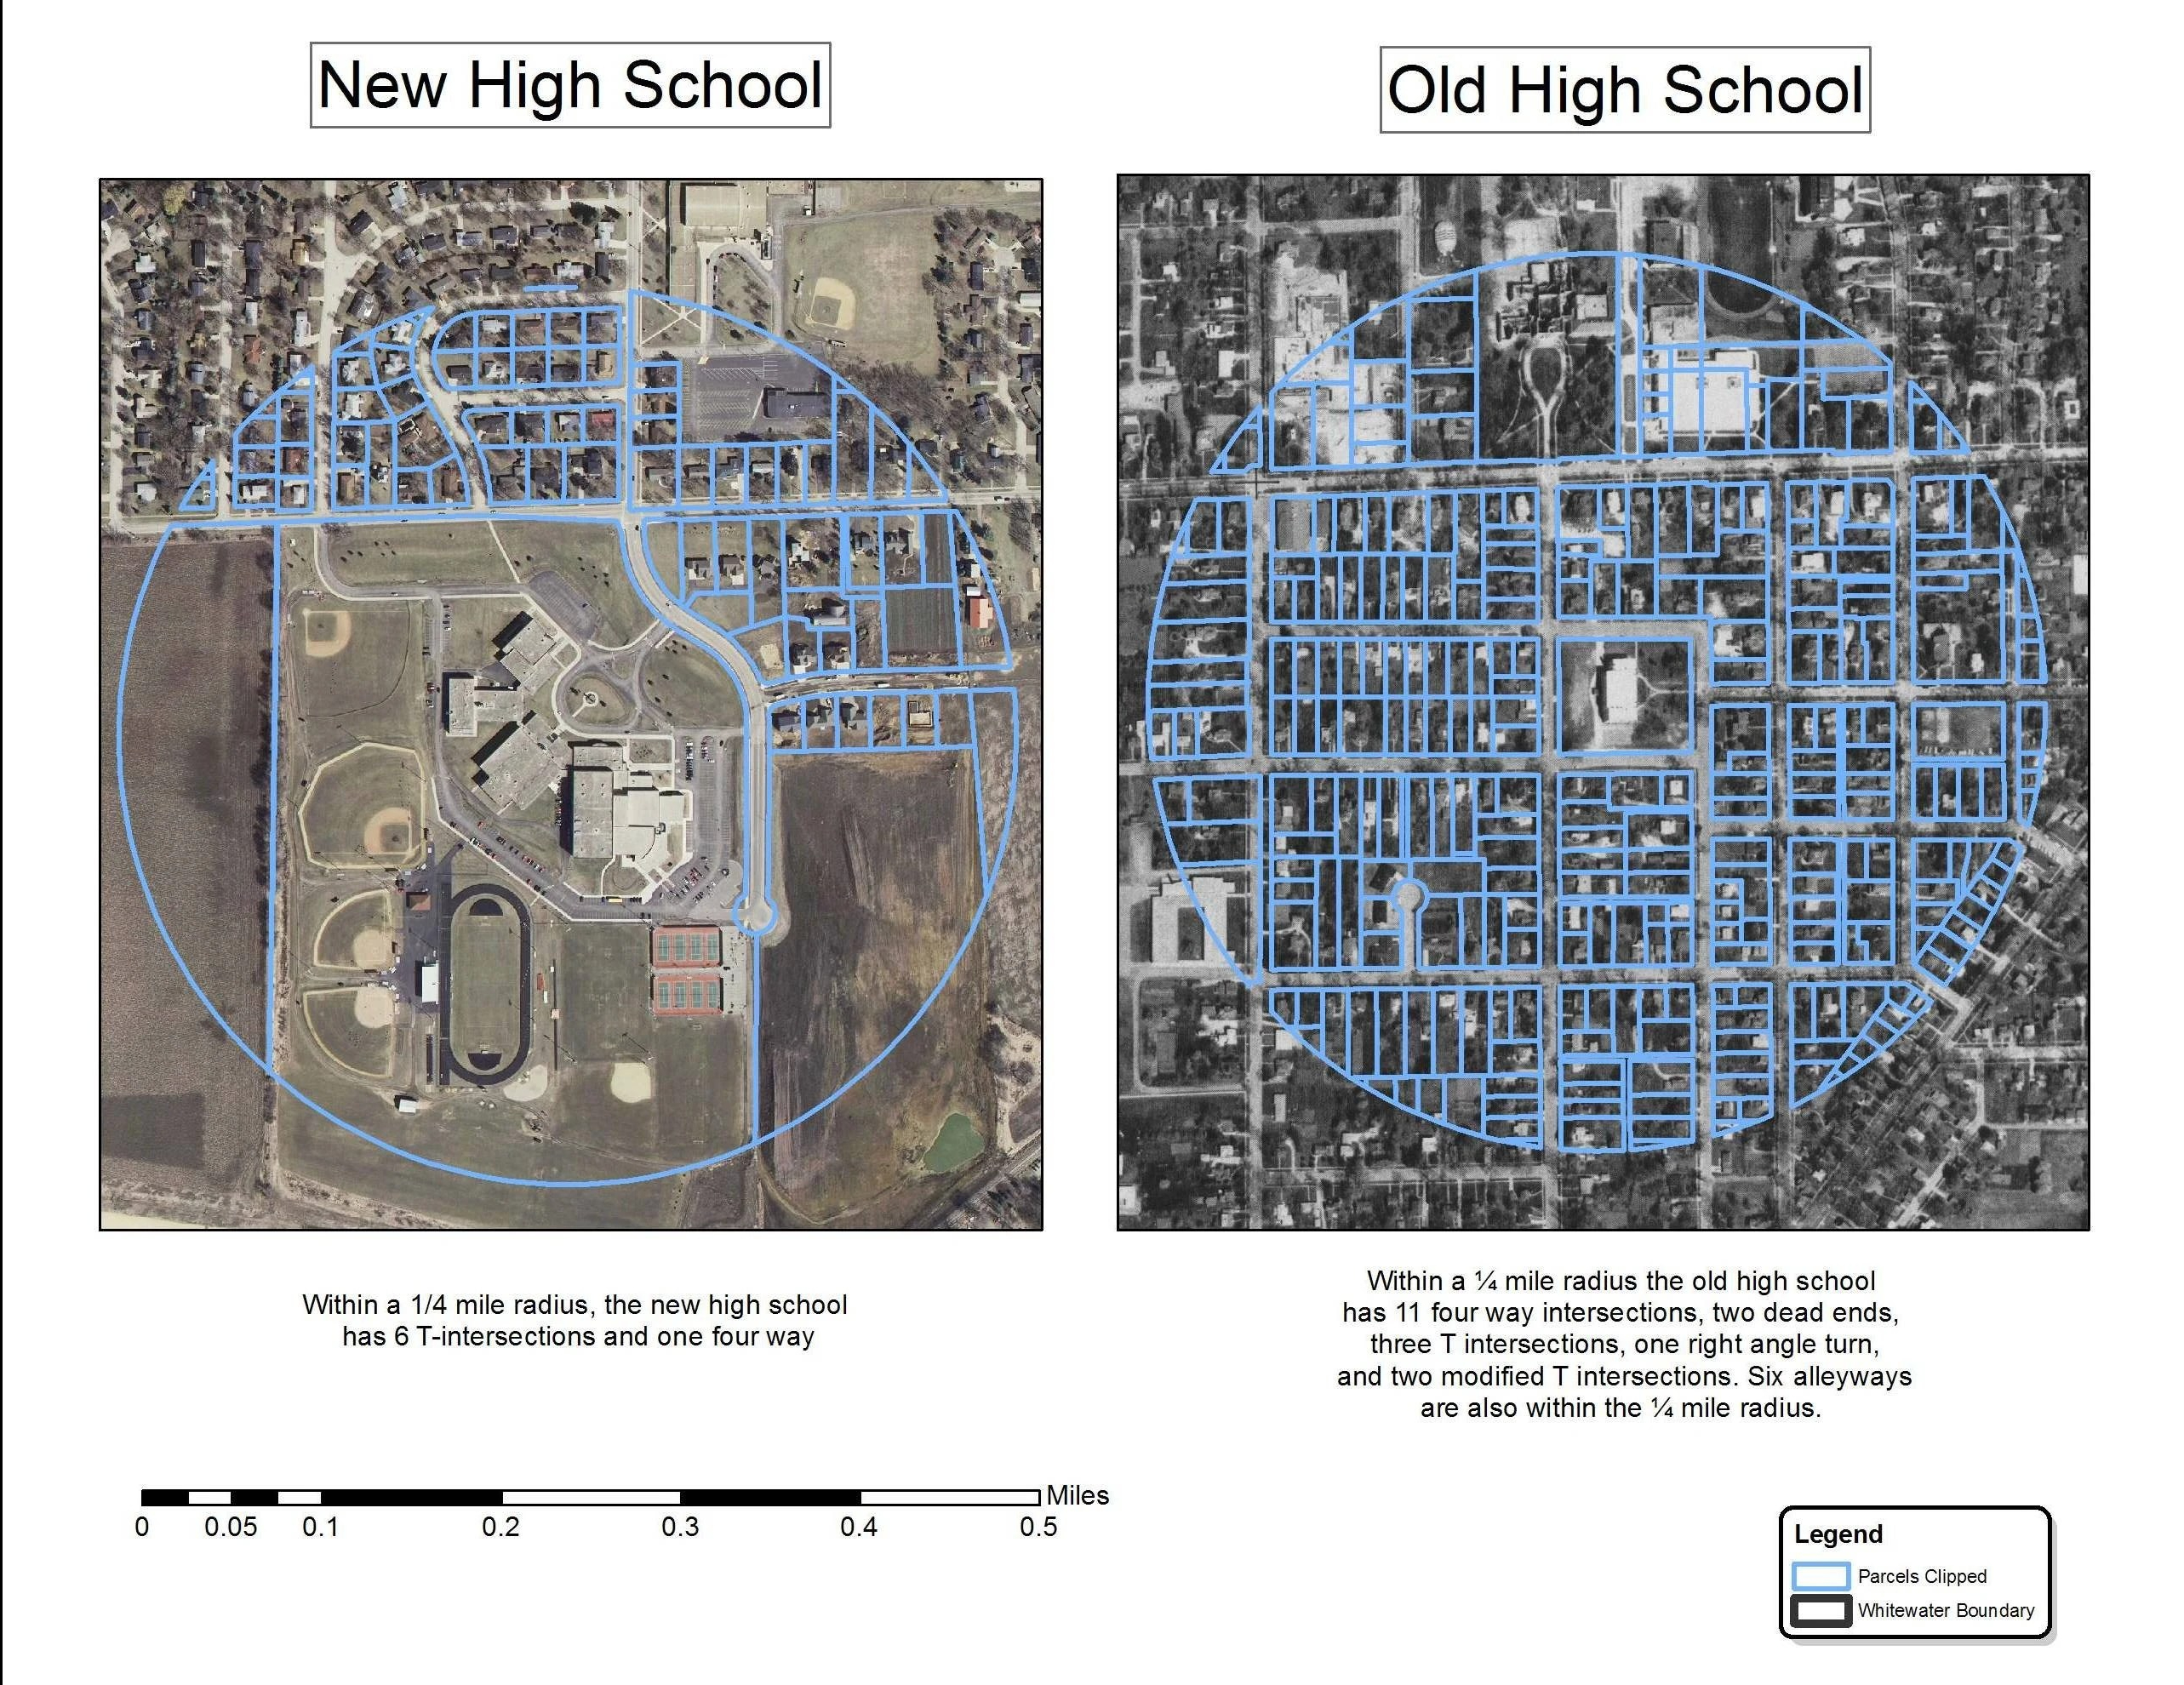
The city exists within a broader regional context characterized by considerable increases in urban land consumption in recent decades and a rising concern over the effects of sprawl. Although there are multiple interpretations of the term “sprawl,” nearly all planners agree that it represents unhealthy growth. This study will document and fully explore the role played by the automobile in reshaping Whitewater’s urban configuration. Therefore, this study focused primarily on how building typologies, street geometries, pedestrian access, and residential density have shaped Whitewater, WI from 1965 to the present.
The following growth patterns were used to define sprawl and demonstrate its hindrance to the pedestrian: leapfrog development, big box and commercial strip development, low density residential areas, large expanses of single-use automobile dependent development, and lack of civic places or public open space (Gillham 4-7).
In recent years, planners have articulated an alternative to automobile dependent development morphologies in “traditional neighborhood development” (TND). This study will conclude with an exploration of the possibilities of importing the TND concept to Whitewater.
